
For investors using technical analysis to find possible opportunities, a common method looks for stocks that are both technically sound and ready for a move soon. This method often uses two main filters: a high technical rating to show the stock is in a good, steady uptrend, and a high setup quality rating to show it is holding in a tight range, possibly getting ready for a breakout. By using these filters together, traders try to enter a stock as it starts moving up again after a pause, providing a good balance of risk and reward.
A recent search using this method found GOLD FIELDS LTD-SPONS ADR (NYSE:GFI) as a stock showing these traits. The gold miner's technical condition and present chart formation indicate it could be getting ready for its next upward move.
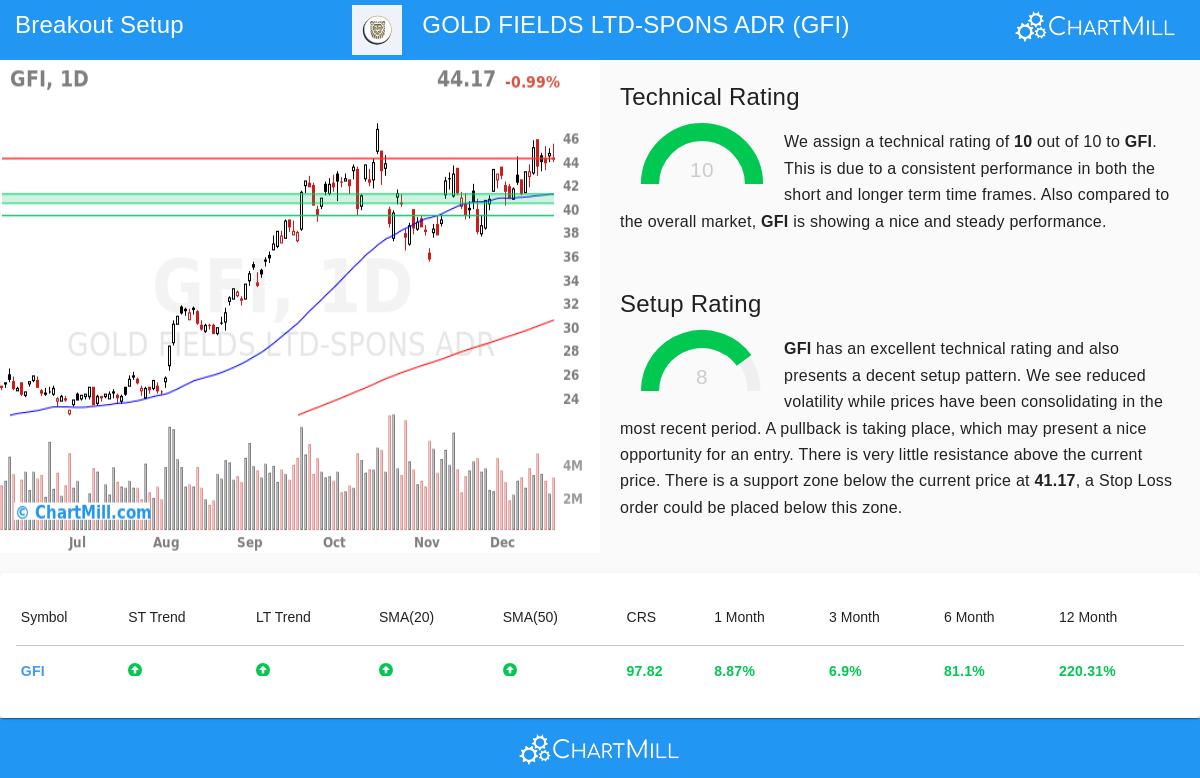
A Base of Technical Soundness
The first step of this breakout method is confirming a stock is in a solid uptrend, as a poor stock is less probable to hold a real breakout. Gold Fields shows very good technical condition, receiving a top ChartMill Technical Rating of 10 out of 10. This high score comes from several areas of soundness that match the method's aims.
- Strong Trend Agreement: Both the recent and longer-term trends for GFI are rated as good. This agreement across timeframes is a solid positive signal, showing momentum is part of a larger, continued move.
- Leading Relative Performance: The stock's performance over the past year puts it in the top 3% of all market stocks, and it does better than 80% of similar companies in the Metals & Mining sector. This strong relative performance is a main sign of leadership, which is what the technical rating filter aims to find.
- Supportive Price Averages: The stock's price is above all its main simple moving averages (20, 50, 100, and 200-day), and each average is also rising. This stacked order of moving averages is a standard sign of a solid positive trend.
A complete look at these and other technical details is in the full ChartMill Technical Report for GFI.
A Sound Setup for a Possible Breakout
While a solid trend is needed, it is not enough for a good entry. The method specifically searches for stocks that are holding steady, or "setting up," to give a clear entry point and a sensible place for a protective stop-loss order. Gold Fields shows a notable setup, seen in its ChartMill Setup Quality Rating of 8.
The technical report states that prices have been holding steady recently with less movement, and calls the formation a "bull flag." This formation usually appears after a strong rise and shows a short pause, which can give a possible entry chance if the earlier uptrend continues.
- Clear Support and Resistance: The analysis finds a defined support area between $40.38 and $41.17, made by a mix of trendlines and moving averages. Below this, the report notes several more support levels. Having a clear support area is important for the method, as it allows placing a stop-loss order just below it, managing risk clearly.
- Little Nearby Resistance: For resistance, a key level is found at $44.18. A clear move above this level could mean the end of the holding pattern and the start of a new breakout. The automated analysis indicates a possible entry point at $44.19, just above this resistance, with a first stop-loss at $41.07.
Market Setting and Points to Note
It is important to note that GFI's soundness is happening while the wider S&P 500 index shows a positive recent trend. While the stock is trading near its own 52-week high, so is the market, making its performance fit with the general setting. For a commodity stock like Gold Fields, investors should also keep in mind larger factors like gold prices and currency changes, which can affect performance aside from the technical view.
Finding Other Opportunities
The search that found Gold Fields is done each day to show new possible breakout setups that meet strict technical and setup quality filters. Investors wanting to see the present list of stocks that qualify can view it on the Technical Breakout Setups screen.
Disclaimer: This article is for information only and is not investment advice, a suggestion, or an offer to buy or sell any security. The analysis, including the automated trade setup, is based on technical indicators and past data, which do not promise future results. Always do your own research, think about your financial position and risk comfort, and talk to a qualified financial advisor before making any investment choices. Using stop-loss orders does not guarantee that losses will be small.