
The process of identifying stocks with high growth potential often involves a dual approach: pinpointing strong technical trends and confirming basic fundamental strength. One organized method for this joins Mark Minervini's Trend Template with a focus on strong-growth momentum. The Trend Template serves as a technical filter, verifying a stock is in a clear, solid uptrend by checking moving average arrangements, nearness to highs, and better relative strength. This is then joined with an evaluation of a company's growth path, searching for quickening earnings, growing profit margins, and favorable analyst revisions. This joined screen seeks to find leading stocks that are not only advancing on the chart but are also supported by solid and getting better business foundations.
GOLD FIELDS LTD-SPONS ADR (NYSE:GFI) appears as a present candidate from this screening method. As a global gold mining company with operations in South Africa, Australia, Ghana, and Peru, its recent results have drawn the notice of both trend and growth-oriented investors.
Technical Fit with the Minervini Trend Template
A central idea of Minervini's strategy is to trade in the direction of the main trend, staying away from poor stocks and concentrating on those showing clear institutional buying. The Trend Template's rules are made to find such solidity, and Gold Fields presently satisfies these technical marks.
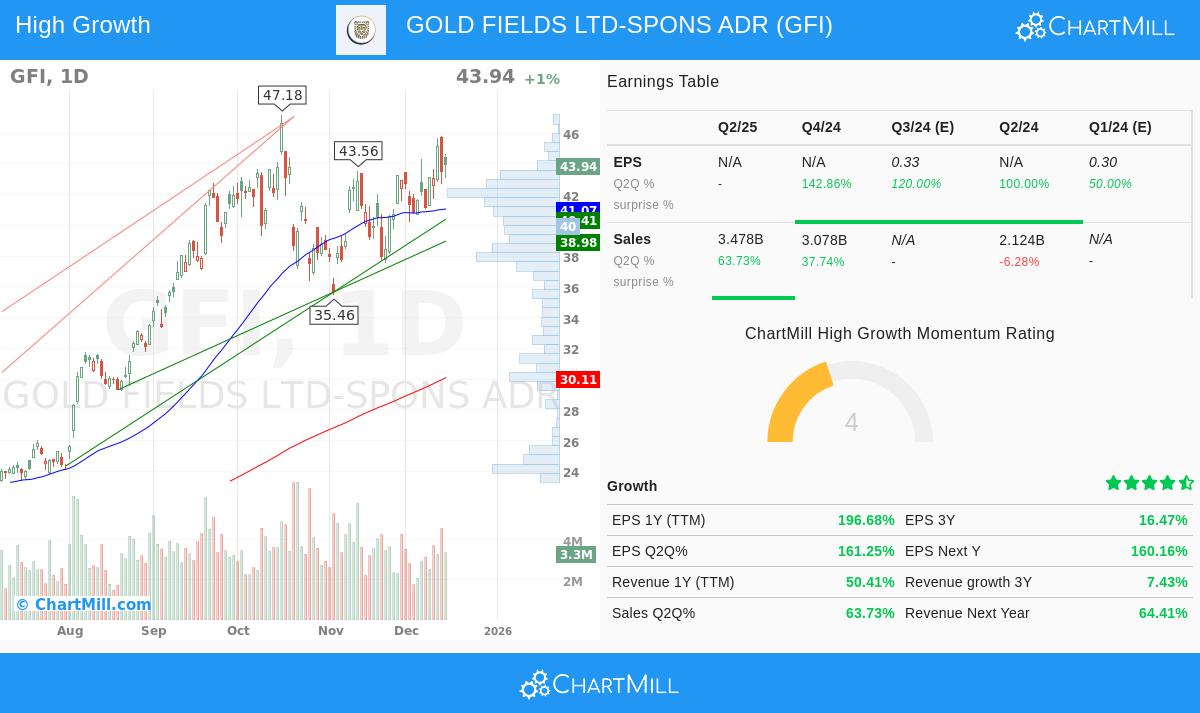
- Moving Average Arrangement: The stock's price is trading above all main simple moving averages (50-day, 150-day, and 200-day), a first condition. Also, these averages are in the correct bullish order: the shorter-term 50-day SMA ($41.07) is above both the 150-day ($32.92) and 200-day ($30.11) averages, and the 150-day is above the 200-day. This layered, rising arrangement confirms a solid and set uptrend across several time periods.
- Nearness to Highs: The stock is trading within 7% of its 52-week high of $47.18, well within the Template's rule of being within 25% of the high. At the same time, its present price is over 238% above its 52-week low, much more than the 30% limit. This shows solid momentum and a maintained comeback from its lows.
- Better Relative Strength: Maybe most notably, GFI has a ChartMill Relative Strength (CRS) rating of 97.67. This means it has done better than almost 98% of all stocks in the market over the past year. Minervini stresses that real market leaders show high relative strength, as it signals buying interest is centered on that specific stock no matter of wider market activity.
Fundamentals Backing Strong Growth Momentum
While the chart shows how the stock is moving, the fundamental data tells why. For a stock to maintain a solid trend, it usually needs the support of quickening business results. Gold Fields shows several measures that fit with a strong-growth momentum view.
- High Earnings Growth: The company has reported very high year-over-year earnings growth. Its EPS growth on a trailing twelve-month (TTM) basis is about 197%. Even more notable is the speed increase clear on a quarterly basis, with the latest quarter showing EPS growth of 161% compared to the same quarter last year.
- Growing Profitability: Growth in revenue and earnings is most useful when it leads to better profitability. Gold Fields' profit margin in the last reported quarter was 29.5%, a large increase from the 15.6% margin reported in the earlier full fiscal year. This shows the company is not just selling more, but doing so more effectively, which can lead to higher cash flow and shareholder returns.
- Favorable Analyst View: The fundamental momentum is being seen. Analyst estimates for the company's next fiscal year have been adjusted higher by over 5% in the last three months. Such upward adjustments often come before continued institutional buying, as they show improving belief in the company's future earnings possibility.
Market and Industry Setting
The stock's technical and fundamental solidity is also seen in its industry position. GFI is doing better than 81% of its peers in the Metals & Mining industry. While the gold sector can be cyclical, the company's specific operational results and financial measures are letting it lead its peer group. Also, with both the short-term and long-term trends for the S&P 500 presently good, the wider market setting is supportive of the continuation of trend-based methods.
Technical Summary and Position
ChartMill's own technical report gives GFI a top score of 10 out of 10, showing very good technical condition marked by its solid trend and high relative strength. The position score is a good 6, showing the stock is settling near its highs after a solid advance. The study finds a clear support area around $40.35-$40.41, made by a combination of moving averages and trendlines. A clear move above the close-term resistance at $43.95 could signal the next phase of the trend.
For a complete look at the support, resistance, and a sample trade position, you can see the full ChartMill Technical Analysis Report for GFI.
Locating Like Chances
Gold Fields shows the kind of candidate that appears when joining strict trend study with a search for fundamental growth speed. Investors trying to use this joined Minervini and strong-growth momentum method to the present market can find other screening results through this High Growth Momentum + Trend Template screen.
Disclaimer: This article is for informational and educational purposes only. It is not intended as investment advice, a suggestion, or an offer to buy or sell any security. The study is based on present data and methods, which are subject to change. Investing includes risk, including the possible loss of principal. Always do your own research, think about your financial position and risk tolerance, and talk with a qualified financial advisor before making any investment choices. Past results are not a guide for future results.