
Gold mining company GOLD FIELDS LTD-SPONS ADR (NYSE:GFI) has been identified as a significant technical breakout candidate by a systematic screening process. The method uses two specific metrics to find interesting trading chances: the ChartMill Technical Rating measures general trend health and technical condition, and the Setup Quality Score finds price patterns that frequently come before notable moves. This two-part system aids technical investors in finding stocks that have both good fundamental momentum and advantageous points to enter, possibly improving the chance of profitable breakout trades.
Technical Strength Evaluation
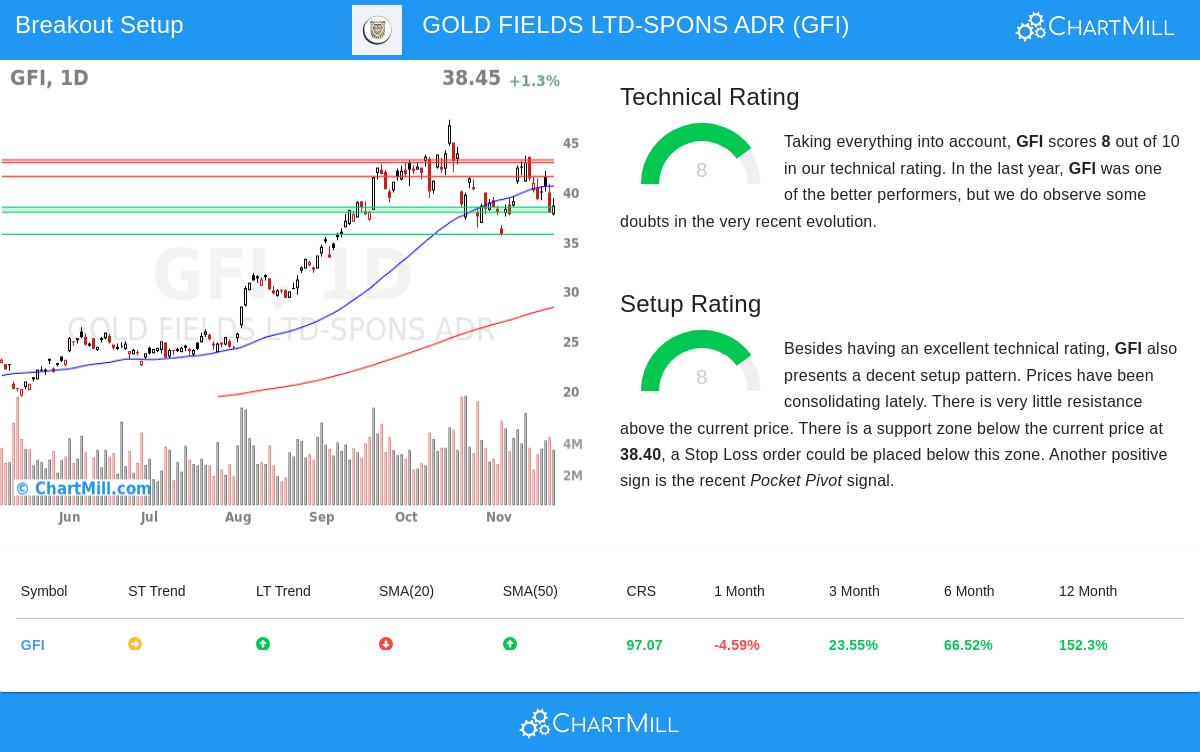
Gold Fields shows very good technical condition with a ChartMill Technical Rating of 8 out of 10, positioning it well within the group of stocks with sound technicals. This score indicates several positive elements that match the breakout method's need for stocks showing clear upward momentum:
- The long-term trend is clearly positive while the short-term trend has become neutral, indicating a possible pause before the next price move
- Performance since the start of the year is better than 97% of all stocks, showing good comparative strength
- The stock is doing better than 84% of similar companies in the Metals & Mining industry group
- All key moving averages (50-day, 100-day, and 200-day) continue to point upward
- The present price is in the higher part of its 52-week range, matching its general market placement
These technical features are important for breakout traders because stocks with good fundamental trends often generate more dependable and longer-lasting breakouts. The steady pattern of increasing prices together with group leadership offers a good base for possible continued moves.
Setup Quality Evaluation
With a Setup Rating of 8, Gold Fields displays an interesting price pattern that technical traders frequently look for before starting a position. The setup review shows several positive circumstances for breakout possibility:
- Recent price movement has created a trading range between $35.46 and $43.56 during the last month
- The stock is now priced in the center of this range, leaving space for a rise
- A recent Pocket Pivot signal shows buying by large investors, which often comes before important gains
- Several defined support areas offer clear stop-loss points, with the closest good support at $38.40
- Little price resistance is found above the present level
The condition of the setup is important because it deals with the timing part of breakout trading. While technical strength shows what to purchase, the setup quality indicates when to purchase. The present trading pattern, along with the Pocket Pivot signal, suggests the stock could be getting ready for its next upward phase.
Trade Framework Points
The technical review indicates a possible move above the $41.48 resistance level, which would confirm the upward trend is continuing. The closeness to this level, together with the defined support structure, creates an advantageous risk-to-reward situation:
- Entry point: Move above $41.48 resistance
- Stop-loss position: Below $37.87 support area
- Risk per share: About $3.61 (8.70% from entry)
- Position size: For 1% portfolio risk, assign about 11.49% of funds
This framework gives a clearly outlined trade structure where the technical levels determine both entry and exit choices, taking out emotional factors from the trading activity.
Market Environment and Perspective
While the S&P 500 shows a negative long-term trend with positive short-term momentum, Gold Fields displays separate strength that could provide variety advantages. The gold mining group often shows different traits than the wider market, especially during times of economic doubt or inflation worries. The stock's good comparative performance suggests it is being moved by group-specific reasons rather than general market momentum.
For investors looking for more technical breakout chances, the Technical Breakout Setups screen offers daily updated choices that fit similar standards for technical strength and setup quality.
Disclaimer: This review is based on technical indicators and pattern identification and should not be taken as investment advice. All trading and investment choices carry risk, and readers should perform their own investigation and speak with financial experts before making any investment choices. Past results do not ensure future outcomes.


