
Technical breakout setups are a favored method for traders aiming to profit from stocks showing solid momentum and consolidation patterns. The strategy relies on two main indicators: the ChartMill Technical Rating, which assesses a stock’s trend health, and the ChartMill Setup Quality Rating, which spots stocks forming promising entry points. Stocks with high scores in both areas frequently offer appealing breakout chances, as they indicate both strong momentum and a clear risk-reward setup.
Gold Fields Ltd-Spons ADR (NYSE:GFI) is currently a standout example for this strategy, with a top Technical Rating of 10 and a matching Setup Rating of 10. This pairing points to a strong upward trend and a consolidation phase that may lead to further gains.
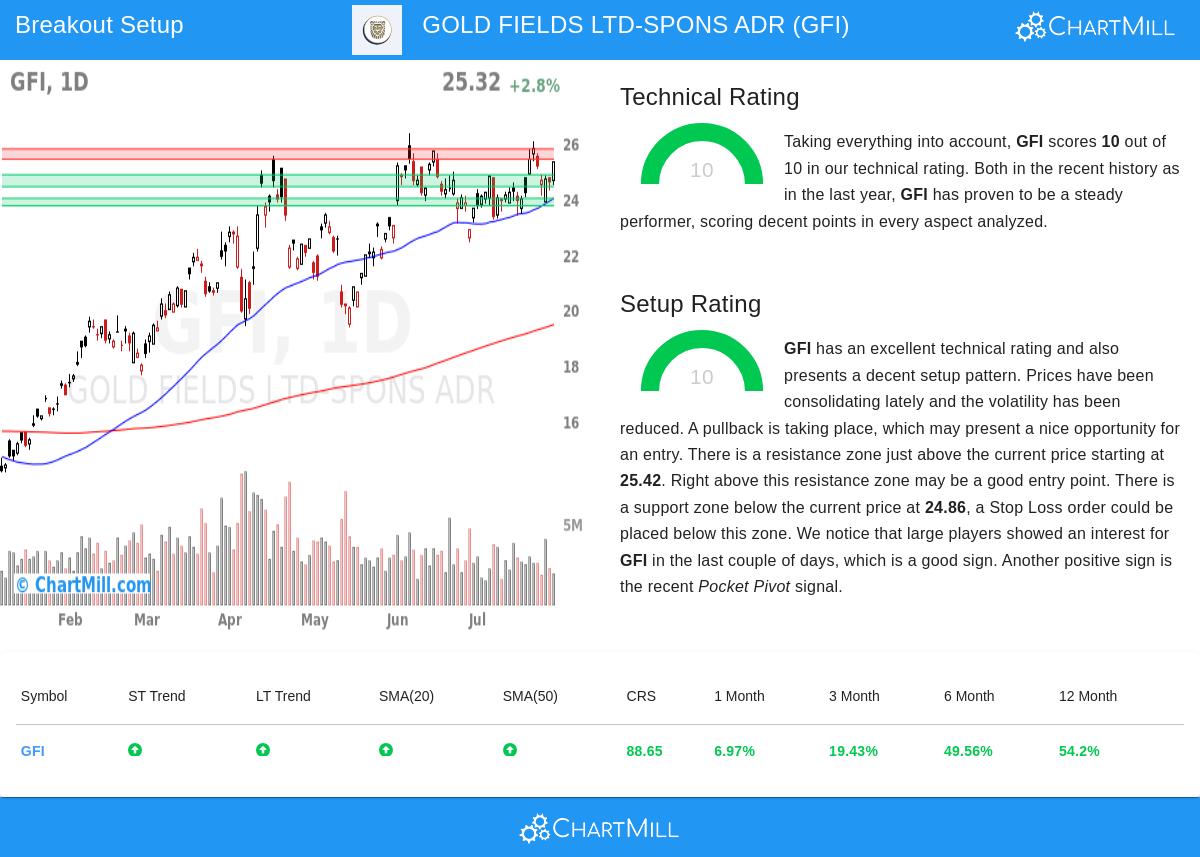
Technical Strength: A Leader in Gold Mining
A high Technical Rating shows a stock’s relative strength, trend stability, and position relative to key moving averages. GFI performs well in these areas, as seen in its technical report:
- Solid Trend Momentum: Both short-term and long-term trends are upward, supporting the stock’s rise.
- Better Performance Than the Market: GFI has done better than 88% of all stocks over the past year, showing steady demand.
- Moving Average Support: The stock is above its 20-day, 50-day, 100-day, and 200-day moving averages, reflecting broad bullish sentiment.
- Good Liquidity: With around 2.8 million shares traded daily, GFI provides enough liquidity for traders.
These factors fit the breakout trading approach, which targets stocks in established uptrends, as they are more likely to continue rising after breaking out of consolidation.
Setup Quality: A Tight Consolidation with Clear Risk Levels
While a strong trend is important, a high-quality setup helps traders enter with clear risk limits. GFI’s Setup Rating of 10 suggests an ideal consolidation pattern:
- Lower Volatility: Recent price movements have narrowed, hinting at a possible breakout.
- Support and Resistance Areas:
- Support at $24.43,$24.86: A clear level where buyers have previously entered.
- Resistance at $25.42,$25.79: A move above this range could lead to more gains.
- Institutional Activity: Large investors have recently increased their holdings, a positive sign.
- Pocket Pivot Signal: A recent price jump with higher volume adds to the evidence of demand.
For traders, this setup provides a clear entry point above resistance ($25.80) with a stop-loss below support ($24.42), capping potential losses at around 5.4%.
Why This Matches the Breakout Strategy
GFI’s strong technicals and high-quality setup align with the best conditions for breakout trading:
- The stock is already rising (reducing the risk of a downtrend).
- The consolidation offers a low-volatility entry before a possible upward move.
- Clear support and resistance levels enable precise trade management.
Finding More Breakout Opportunities
GFI is one of many stocks currently showing strong breakout signals. Traders looking for more ideas can check the Technical Breakout Setups screener, which offers a daily-updated list of high-potential setups.
Disclaimer: This analysis is for informational purposes only and should not be seen as investment advice. Trading carries risks, and past performance does not guarantee future results. Always do your own research before making investment decisions.