
GOLD FIELDS LTD-SPONS ADR (NYSE:GFI) has emerged as a compelling candidate for investors following Mark Minervini’s trend-following strategy while also meeting high-growth momentum criteria. The stock demonstrates strong technical health and solid fundamental growth, making it worth a closer look.
Why GFI Fits the Minervini Trend Template
Minervini’s Trend Template identifies stocks in strong uptrends with favorable technical conditions. GFI meets all key criteria:
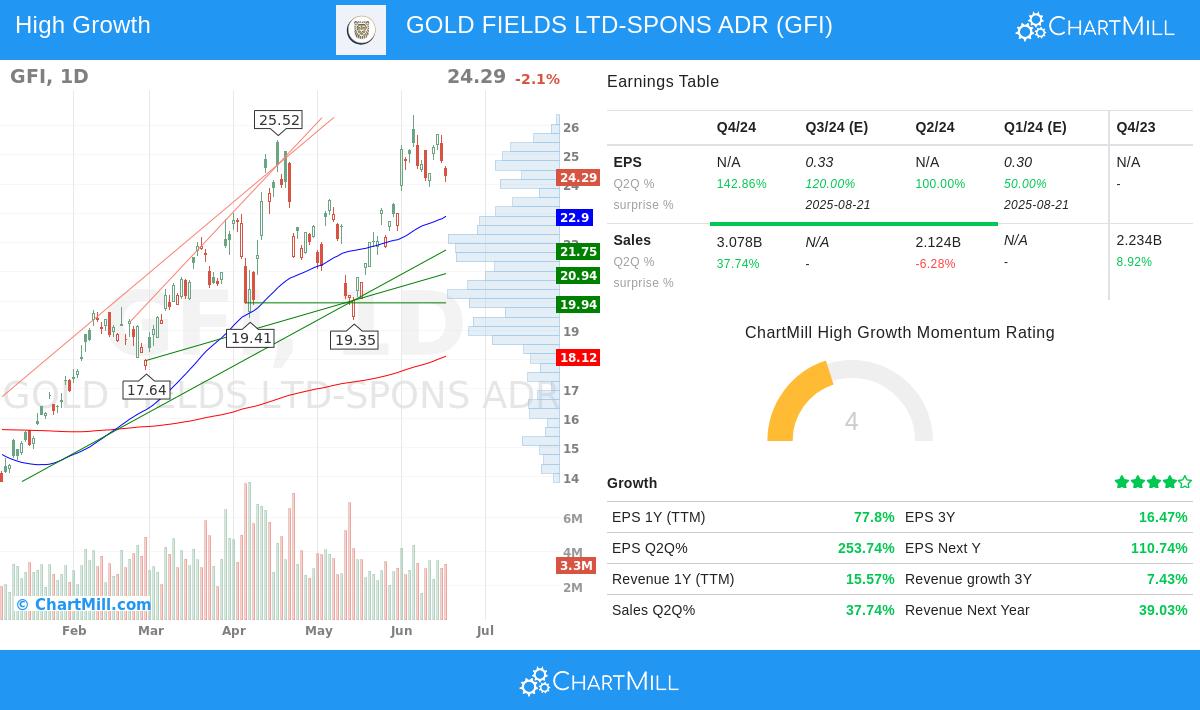
- Price Above Key Moving Averages: The stock trades above its 50-day ($22.90), 150-day ($18.95), and 200-day ($18.12) moving averages, confirming a bullish trend.
- Rising Moving Averages: Both the 150-day and 200-day MAs are trending upward, reinforcing long-term strength.
- Relative Strength: GFI’s ChartMill Relative Strength (CRS) of 92.53 indicates it outperforms 92% of the market.
- Price Near 52-Week High: At $24.29, GFI is within 8% of its 52-week high ($26.36), a sign of strong momentum.
- Volatility Contraction: The stock has consolidated recently, reducing volatility—a key setup for potential breakouts.
High-Growth Momentum Fundamentals
Beyond technical strength, GFI exhibits strong earnings and revenue growth:
- EPS Growth (TTM): +77.8% year-over-year, with quarterly EPS surging +253.7% in the latest report.
- Revenue Growth (TTM): +15.6%, reflecting steady demand for gold and copper production.
- Profit Margin Expansion: Improved to 27.8% (latest quarter) from 15.6% a year ago, signaling better cost efficiency.
- Free Cash Flow Growth: +203% over the past year, indicating strong operational cash generation.
- Analyst Revisions: EPS estimates for next year have been revised upward by 75.7% in the last three months.
Technical Outlook & Trade Setup
The technical report highlights:
- Support Zones: Multiple levels between $23.92 and $24.28 provide downside protection.
- Resistance: Near $25.71, a breakout above this level could signal further upside.
- Recent Strength: A "Pocket Pivot" signal suggests institutional buying interest.
Our High Growth Momentum + Trend Template screener lists more stocks with similar characteristics, updated daily.
Disclaimer
This is not investment advice. The analysis reflects observations at the time of writing, but market conditions can change. Always conduct your own research before making investment decisions.