
For technical investors, the search for promising trades often comes down to two core questions: which stock is in a strong trend, and when is the right time to enter that trend? A systematic approach to answering these questions involves screening for stocks that combine sound underlying technical health with a current price pattern that suggests a possible breakout from a period of sideways movement. This method seeks to find opportunities in leading stocks as they pause to build energy before their next possible move upward.
General Electric (NYSE:GE) currently shows a profile that fits this breakout screening method. The company, now operating as GE Aerospace after its corporate restructuring, is a major force in aircraft engines and systems. Its technical picture, as described in a recent ChartMill Technical Analysis report, points to a stock that is both technically sound and forming a constructive pattern.
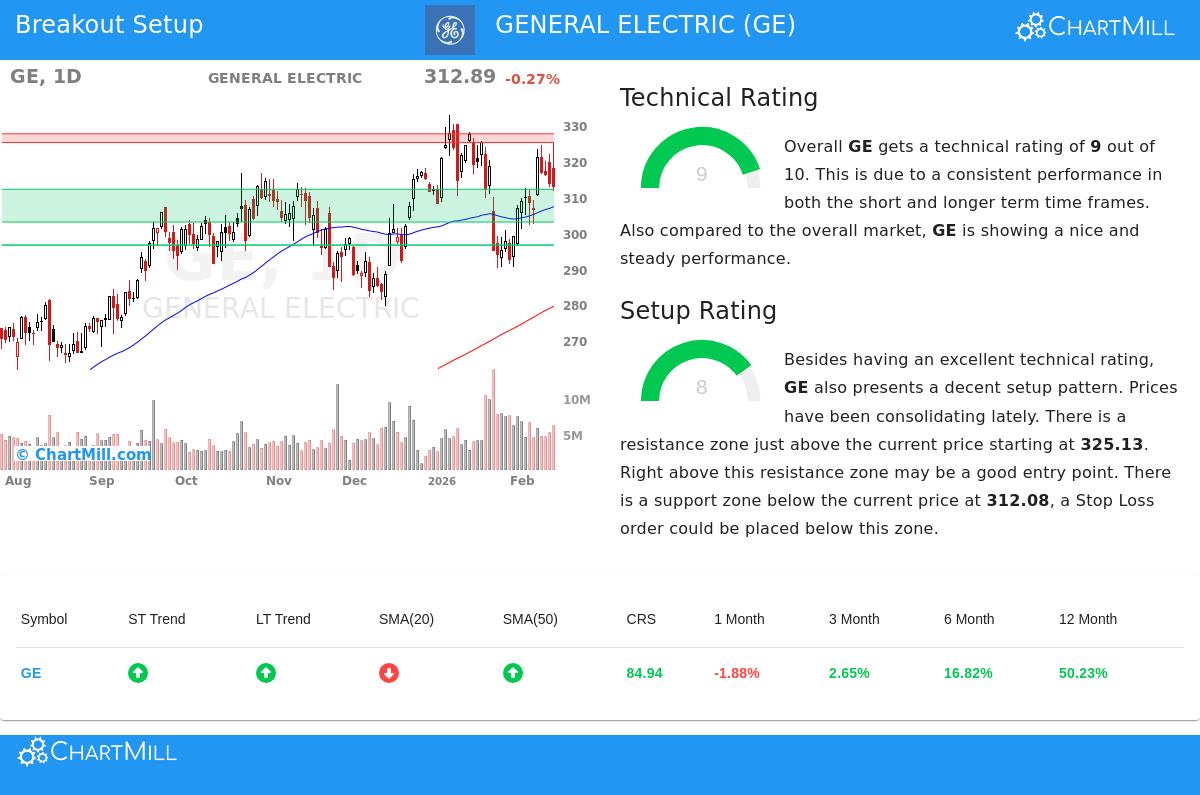
Looking at the Technical Foundation
The first part of a breakout setup is a strong underlying trend. A stock must show sustained upward momentum and relative strength to be seen as a leader. GE’s technical rating of 9 out of 10 signals very good health from this view. The report notes several key strengths that build this high score:
- Positive Trend Alignment: Both the long-term and short-term trends for GE are rated as positive. This agreement across timeframes is a clear sign of a healthy, continuing uptrend.
- Strong Relative Performance: Over the last year, GE’s performance ranks better than 84% of all other stocks. This better relative strength is a key filter for finding market leaders.
- Position Near Highs: The stock is now trading near its 52-week high, which is usually a positive indicator. The report states this performance matches the wider market, which is also near highs.
- Support from Moving Averages: The stock’s price is above important rising moving averages (50-day, 100-day, and 200-day), which act as dynamic support levels and confirm the trend’s direction.
This sound technical background is necessary because it raises the chance that any breakout from a period of sideways movement will continue in the direction of the main trend, instead of failing or turning down.
Looking at the Setup Quality
A strong trend by itself is not a buy signal, entering a stock that has recently made a large, extended move can be risky. The second part, therefore, is finding a good setup, a time of sideways movement that gives a clear entry point and a logical area to set a protective stop-loss order. GE’s setup rating of 8 reflects a positive consolidation pattern.
The technical report states that "prices have been consolidating lately." Specifically, over the last month, GE has traded in a range between about $290 and $325. This time of sideways action after a strong upward move lets the stock reduce any overbought conditions and form a new base of support.
- Defined Resistance and Support: The consolidation has made clear technical levels. A resistance zone is noted just above the current price, ranging from $325.13 to $327.55. A move above this zone could signal the beginning of the next upward phase. Below the current price, a major support zone exists from $302.95 to $312.08, giving a possible area to control risk.
- A Specific Trading Scenario: Based on this pattern, the automated analysis points to a possible breakout setup. It describes an entry point just above the resistance zone at $327.56, with a stop-loss order set below the support zone at $302.94. This sets a clear risk parameter of about 7.5% on the trade.
This structured setup is key for the method, as it gives a disciplined plan for entry and risk control, moving past subjective guesswork.
Summary and Next Steps
The mix of GE’s high technical rating (9) and its good setup rating (8) makes it a candidate worth notice for investors using a technical breakout plan. The stock shows the traits of a market leader in a confirmed uptrend, now resting in a consolidation that gives defined reference points for a possible trade.
It is important to recall that technical patterns show probabilities, not guarantees. Any trade should be thought about within the frame of an investor’s total risk tolerance and portfolio plan. The suggested entry and exit levels from the report are example starting points for one’s own study.
Interested in finding other stocks now showing similar technical breakout signals? You can find an updated list by running the Technical Breakout Setups screen.
Disclaimer: This article is for informational purposes only and does not constitute investment advice, a recommendation, or an offer or solicitation to buy or sell any securities. The analysis presented is based on technical data and should not be the only basis for any investment decision. Investors should do their own research and talk with a qualified financial advisor before making any investment decisions. Past performance is not a guide to future results.