
For investors looking to join strict technical discipline with fundamental growth study, the methods of Mark Minervini offer a notable structure. Minervini's plan, called Specific Entry Point Analysis (SEPA), methodically finds stocks set for large moves by sorting for those already in strong uptrends, using his Trend Template, and then adding strict fundamental rules for earnings and sales growth. This two-part method tries to take market leaders early in their big climbs. A recent filter using this joined thinking has pointed to General Electric (NYSE:GE) as a candidate worth more study.
Meeting the Minervini Trend Template
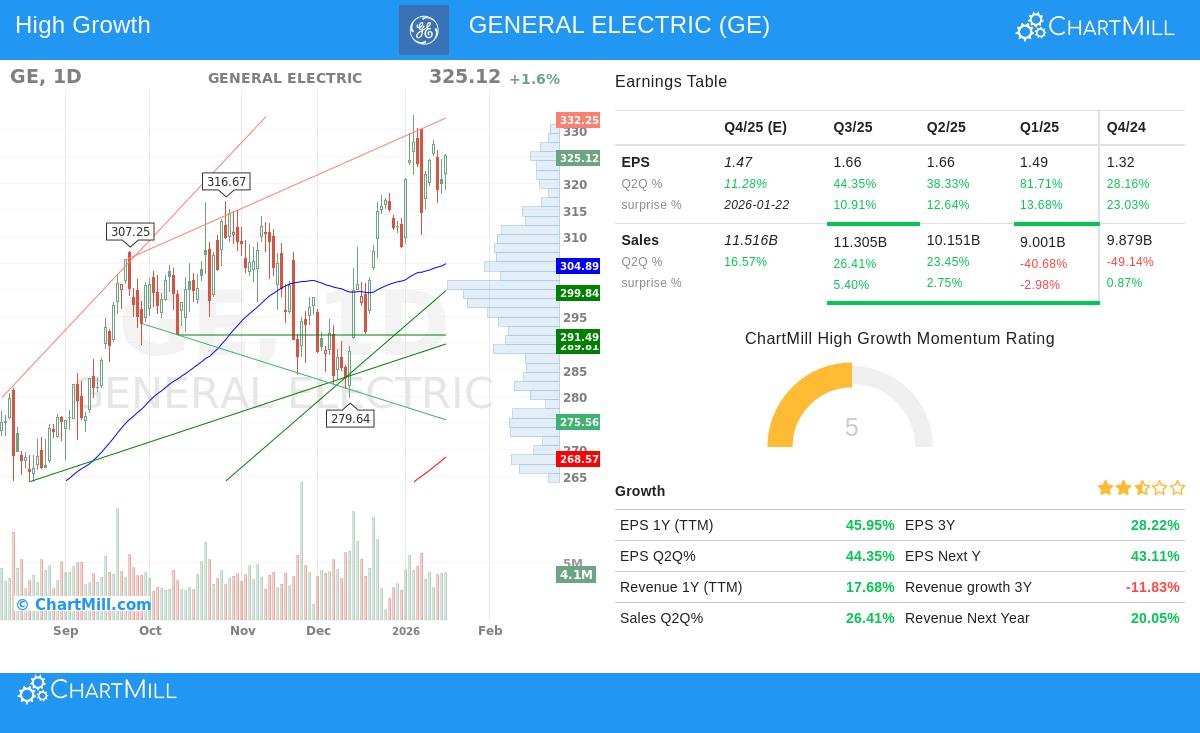
The base of Minervini's technical filtering is the Trend Template, a group of fixed rules made to make sure a stock is in a verified, lasting uptrend. General Electric's present chart shows a clear match with these rules:
- Price Above Key Moving Averages: The stock trades well above its rising 50-day ($304.89), 150-day ($286.71), and 200-day ($268.57) simple moving averages. This ordered position shows strength across short, medium, and long-term periods.
- Moving Average Order: The 50-day moving average is above both the 150-day and 200-day averages, while the 150-day is above the 200-day. This "bullish order" verifies gaining speed and a sound stage 2 uptrend.
- Nearness to Highs: With a present price of $325.12, GE is trading within 2.3% of its 52-week high of $332.79, well within the Template's rule of being within 25% of the high. It also sits more than 100% above its 52-week low, showing strong recovery speed.
- Better Relative Strength: A main idea of Minervini's thinking is to focus on market leaders. GE's relative strength (RS) ranking of 91.06 shows it is doing better than over 91% of all stocks, a clear mark of institutional buying and leadership.
This technical view is not happening alone. It matches the wider market's positive long and short-term directions, giving a helpful setting for leading stocks to keep their climbs.
Qualifying for High Growth Momentum
While the Trend Template finds the "how," the "why" behind a stock's move is often seen in its fundamental results. The High Growth Momentum (HGM) part of the filter looks for companies showing gaining financial strength, a sign of Minervini's SEPA plan. GE's recent numbers show a company in the middle of a strong operational recovery:
- Large Earnings Growth: The company's trailing twelve-month (TTM) EPS of $6.13 shows a large year-over-year growth of 46%. Even more notable is the gaining speed in three-month EPS growth: 28% (Q-3), 82% (Q-2), 38% (Q-1), and 44% in the newest quarter. This pattern of gaining speed is a key sign Minervini looks for, hinting at better business conditions.
- Steady Earnings Surprises: GE has topped analyst EPS guesses in all of the last four quarters, with an average surprise of over 15%. This steady better performance often works as a trigger, pushing more institutional interest and upward changes.
- Sound and Growing Profitability: The company's profit margin in the last quarter was a solid 17.7%. More importantly, free cash flow per share has grown by 17.5% over the past year to $6.11, giving the financial means for more growth, new ideas, and shareholder gains.
- Positive Analyst Changes: Analysts have been raising their guesses, with the average EPS guess for the next year changed upward by 5.66% over the last three months. This "guess change" is a key fundamental trigger that often comes before more price gains.
Technical Health and Setup Summary
Beyond the basic filter rules, a closer look at GE's technical health through ChartMill's own study supports the bullish idea. The stock gets a perfect Technical Rating of 10/10, showing very good strength across many periods and measures. The study notes the stock is showing a bull flag pattern, a known continuation setup that often appears inside strong uptrends.
The setup quality is rated a solid 6, showing prices have been settling recently with less change, which can come before the next step higher. The technical report finds clear support areas near $300 and $290, giving logical places for risk control, while resistance is noted around the $326 level.
You can see the full, detailed technical study for GE here: ChartMill Technical Analysis Report for GE.
Conclusion
General Electric presents a notable example of a stock that matches a disciplined growth-and-speed investment plan. It meets the strict technical filters of the Minervini Trend Template, checking it is a market leader in a strong uptrend. At the same time, its fundamental picture, marked by gaining earnings, steady beats, sound cash flow, and positive guess changes, gives the basic growth motor that Minervini's SEPA plan tries to use. For investors filtering for high-growth candidates inside set uptrends, GE calls for more careful study.
Interested in finding more stocks that fit this joined growth and speed picture? You can run the same "High Growth Momentum + Trend Template" filter yourself to find other possible candidates: Run the High Growth Momentum + Trend Template Screen.
Disclaimer: This article is for information and learning only. It is not a suggestion to buy or sell any security. The study is based on given data and certain filter methods. Always do your own full research, think about your personal money situation, and talk with a qualified financial advisor before making any investment choices. Past results are not a sign of future results.