
For investors looking for chances in companies priced below their true worth, a methodical screening method can help find stocks trading for less than their real value while having good basic qualities. The "Decent Value" screen looks for companies with good valuation measures (a score of 7 or more) along with acceptable profitability, financial condition, and growth pictures. This method fits with value investing ideas by concentrating on stocks that seem to cost less than their actual value while steering clear of companies with basic problems that might suggest false bargains.
Genpact Ltd (NYSE:G) stands out as a noteworthy candidate from this screening method, offering an interesting example for value investing possibility. The business process management company works with clients in financial services, consumer and healthcare, and high-tech manufacturing industries, using process intelligence and artificial intelligence to provide clear results for its worldwide clients.
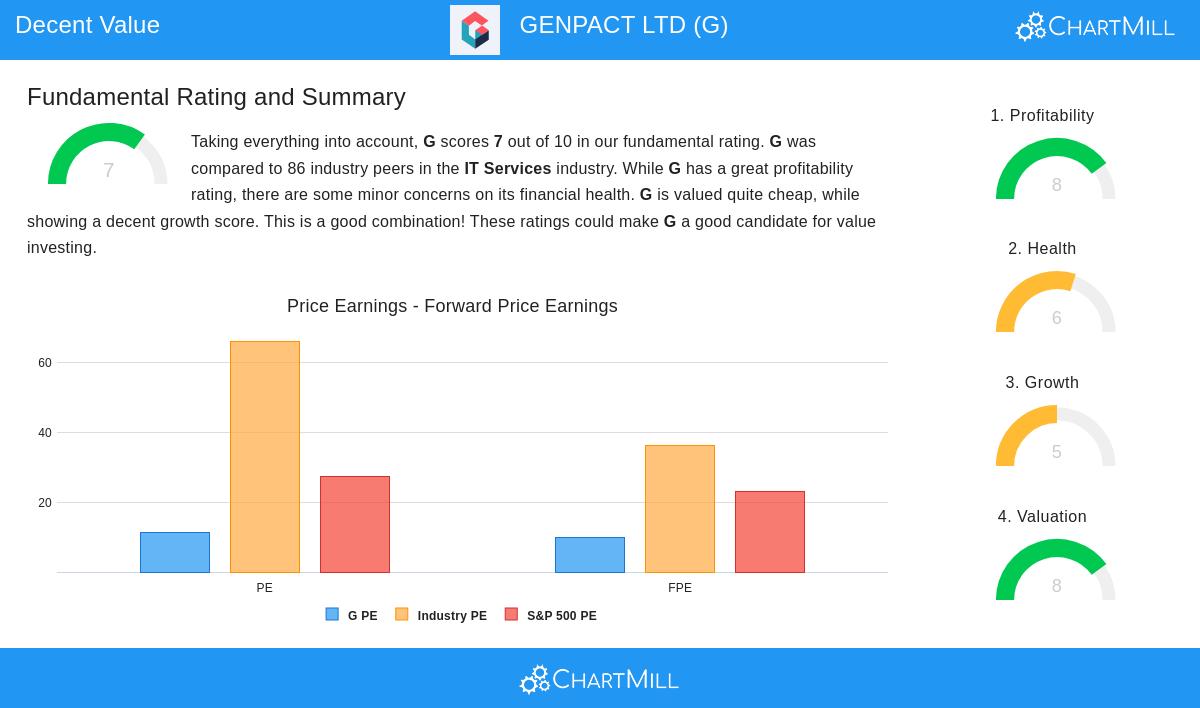
Valuation Metrics
Genpact's most notable feature is in its valuation measures, which get an 8 out of 10 in ChartMill's evaluation. The company seems notably priced below its true value compared to both industry competitors and wider market measures:
- P/E ratio of 11.33 is better than the industry average of 66.08 and S&P 500 average of 27.42
- Forward P/E of 9.95 is much lower than the industry average of 36.20 and S&P 500 average of 22.94
- Enterprise Value to EBITDA and Price/Free Cash Flow ratios both show Genpact is less expensive than about 80-87% of industry rivals
- Low PEG ratio shows the present price sufficiently accounts for anticipated growth
For value investors, these valuation numbers point to a possible safety buffer, a central idea in value investing where the difference between market price and real value offers some protection from loss.
Profitability Assessment
The company shows good profitability with a score of 8 out of 10, pointing to effective operations and solid returns:
- Return on Assets of 10.14% is better than 86% of industry competitors
- Return on Equity of 20.81% puts Genpact in the top 15% of the industry
- Return on Invested Capital of 13.94% is higher than 85% of rivals
- Profit margin of 10.92% and operating margin of 14.91% both are in the top quarter of the industry
- Steady profitability over the last five years with getting better margins
These profitability numbers are important for value investors as they show the company has lasting competitive strengths and capable management, key elements in figuring out long-term real value beyond just being inexpensive on paper.
Financial Health
With a financial condition score of 6 out of 10, Genpact keeps a satisfactory balance sheet setup:
- Altman-Z score of 3.42 shows low failure risk
- Debt-to-Equity ratio of 0.36 points to reasonable borrowing
- Debt-to-Free-Cash-Flow ratio of 2.34 shows the company could pay back all debt in less than two-and-a-half years from operating cash flows
- Current and quick ratios of 1.53 give enough short-term cash availability
- Steady reduction in share count over several years shows capital return favorable to shareholders
While not extremely solid, this health picture gives enough steadiness for value investors, lowering the chance of a total loss of money, another key thought in value investing methods.
Growth Trajectory
Genpact's growth picture scores an acceptable 5 out of 10, showing steady, if not amazing, expansion:
- Earnings per share growth of 14.85% over the last year
- Five-year average EPS growth of 9.38%
- Revenue growth of 7.40% each year with steady performance
- Expected future EPS growth of 11.10% each year
- Stable growth path with consistent past and forecasted expansion rates
For value investors, this moderate growth picture adds to the good valuation, suggesting the company is not just inexpensive because of business decline but may represent real under pricing.
Dividend Characteristics
The company provides a dividend yield of 1.75% with good features:
- Dividend growth rate of 12.42% each year over recent years
- Ten-year history of dividend payments
- Manageable payout ratio of 21.00%
- Performs better than 87% of industry competitors on dividend yield
While not a main concern for all value investors, the increasing dividend gives extra total return possibility and shows management's belief in the business's ability to create cash flow.
The detailed fundamental analysis report gives more information on these measures and how they compare to industry norms. For investors wanting to find similar chances, the Decent Value Stocks screen regularly refreshes with companies meeting these requirements.
Disclaimer: This analysis is based on fundamental data and screening methods for information only. It does not make up investment advice, suggestion, or support of any security. Investors should do their own research and think about their personal money situation before making investment choices.

