
Discover GENPACT LTD (NYSE:G), an undervalued stock highlighted by our stock screener. G showcases solid financial health and profitability while maintaining an appealing valuation. We'll explore the details.
A Closer Look at Valuation for G
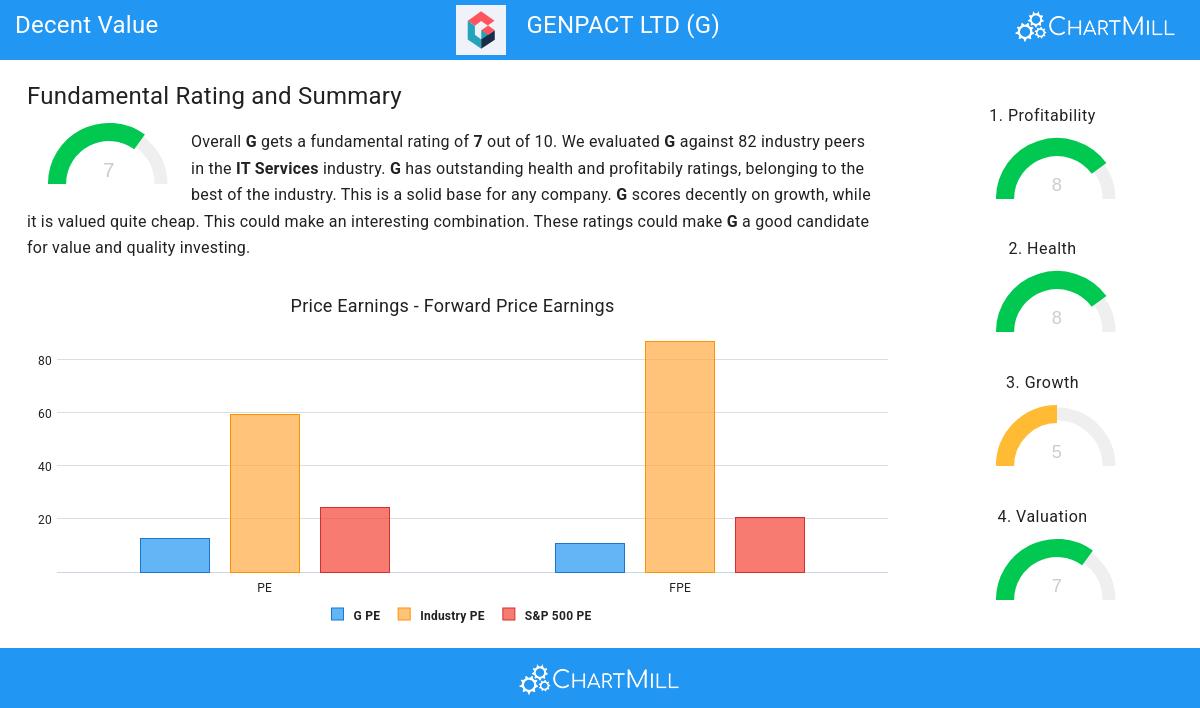
ChartMill provides a Valuation Rating to every stock, ranging from 0 to 10. This rating assesses various valuation aspects, comparing price to earnings and cash flows, while considering factors like profitability and growth. G boasts a 7 out of 10:
- 86.59% of the companies in the same industry are more expensive than G, based on the Price/Earnings ratio.
- The average S&P500 Price/Earnings ratio is at 24.21. G is valued slightly cheaper when compared to this.
- The Price/Forward Earnings ratio is 10.71, which indicates a very decent valuation of G.
- G's Price/Forward Earnings ratio is rather cheap when compared to the industry. G is cheaper than 87.80% of the companies in the same industry.
- Compared to an average S&P500 Price/Forward Earnings ratio of 20.44, G is valued a bit cheaper.
- 80.49% of the companies in the same industry are more expensive than G, based on the Enterprise Value to EBITDA ratio.
- 87.80% of the companies in the same industry are more expensive than G, based on the Price/Free Cash Flow ratio.
- G has an outstanding profitability rating, which may justify a higher PE ratio.
Understanding G's Profitability
ChartMill assigns a Profitability Rating to every stock. This score ranges from 0 to 10 and evaluates the different profitability ratios and margins, both absolutely, but also relative to the industry peers. G scores a 8 out of 10:
- With an excellent Return On Assets value of 10.30%, G belongs to the best of the industry, outperforming 86.59% of the companies in the same industry.
- Looking at the Return On Equity, with a value of 21.50%, G belongs to the top of the industry, outperforming 85.37% of the companies in the same industry.
- With an excellent Return On Invested Capital value of 13.24%, G belongs to the best of the industry, outperforming 80.49% of the companies in the same industry.
- The 3 year average ROIC (12.82%) for G is below the current ROIC(13.24%), indicating increased profibility in the last year.
- G's Profit Margin of 10.78% is fine compared to the rest of the industry. G outperforms 78.05% of its industry peers.
- In the last couple of years the Profit Margin of G has grown nicely.
- Looking at the Operating Margin, with a value of 14.73%, G belongs to the top of the industry, outperforming 80.49% of the companies in the same industry.
- G's Operating Margin has improved in the last couple of years.
Health Analysis for G
Every stock is evaluated by ChartMill, receiving a Health Rating on a scale of 0 to 10. This assessment considers different health aspects, including liquidity and solvency, both in absolute terms and relative to industry peers. G has achieved a 8 out of 10:
- G has an Altman-Z score of 3.73. This indicates that G is financially healthy and has little risk of bankruptcy at the moment.
- G has a Altman-Z score of 3.73. This is in the better half of the industry: G outperforms 60.98% of its industry peers.
- G has a debt to FCF ratio of 2.34. This is a good value and a sign of high solvency as G would need 2.34 years to pay back of all of its debts.
- G has a Debt to FCF ratio of 2.34. This is in the better half of the industry: G outperforms 68.29% of its industry peers.
- Even though the debt/equity ratio score it not favorable for G, it has very limited outstanding debt, so we won't put too much weight on the DE evaluation.
- G has a Current Ratio of 2.16. This indicates that G is financially healthy and has no problem in meeting its short term obligations.
- The Current ratio of G (2.16) is better than 69.51% of its industry peers.
- A Quick Ratio of 2.16 indicates that G has no problem at all paying its short term obligations.
- G has a better Quick ratio (2.16) than 69.51% of its industry peers.
Growth Analysis for G
A key component of ChartMill's stock assessment is the Growth Rating, which spans from 0 to 10. This rating evaluates diverse growth factors, such as EPS and revenue growth, considering both past performance and future projections. G has received a 5 out of 10:
- The Earnings Per Share has grown by an nice 9.57% over the past year.
- The Earnings Per Share has been growing by 9.38% on average over the past years. This is quite good.
- G is expected to show quite a strong growth in Earnings Per Share. In the coming years, the EPS will grow by 11.31% yearly.
- When comparing the EPS growth rate of the last years to the growth rate of the upcoming years, we see that the growth is accelerating.
- When comparing the Revenue growth rate of the last years to the growth rate of the upcoming years, we see that the growth is accelerating.
Our Decent Value screener lists more Decent Value stocks and is updated daily.
Check the latest full fundamental report of G for a complete fundamental analysis.
Disclaimer
This is not investing advice! The article highlights some of the observations at the time of writing, but you should always make your own analysis and invest based on your own insights.