
For investors looking to join solid technical patterns with strong fundamental growth, a methodical plan can be very useful. One such method is supported by well-known trader Mark Minervini, whose plan depends on his own Trend Template and Specific Entry Point Analysis (SEPA). This structure is made to spot market leaders early in their main price increases by requiring exact agreement of technical and fundamental measures. The aim is to locate stocks already in strong upward moves, supported by improving earnings and sales, thus improving the chances for the investor for notable gain in value.
FUTU HOLDINGS LTD-ADR (NASDAQ:FUTU) comes forward as an interesting candidate when assessed through this two-part method. The Hong Kong-based fintech company, which offers digital brokerage and wealth management services on its Futu NiuNiu platform, seems to display the traits Minervini links with possible high achievers.
Technical Strength: Matching the Trend Template
Minervini's Trend Template gives a strict technical list to confirm a stock is in a verified, lasting upward move before review. FUTU shows a solid match with these main ideas:
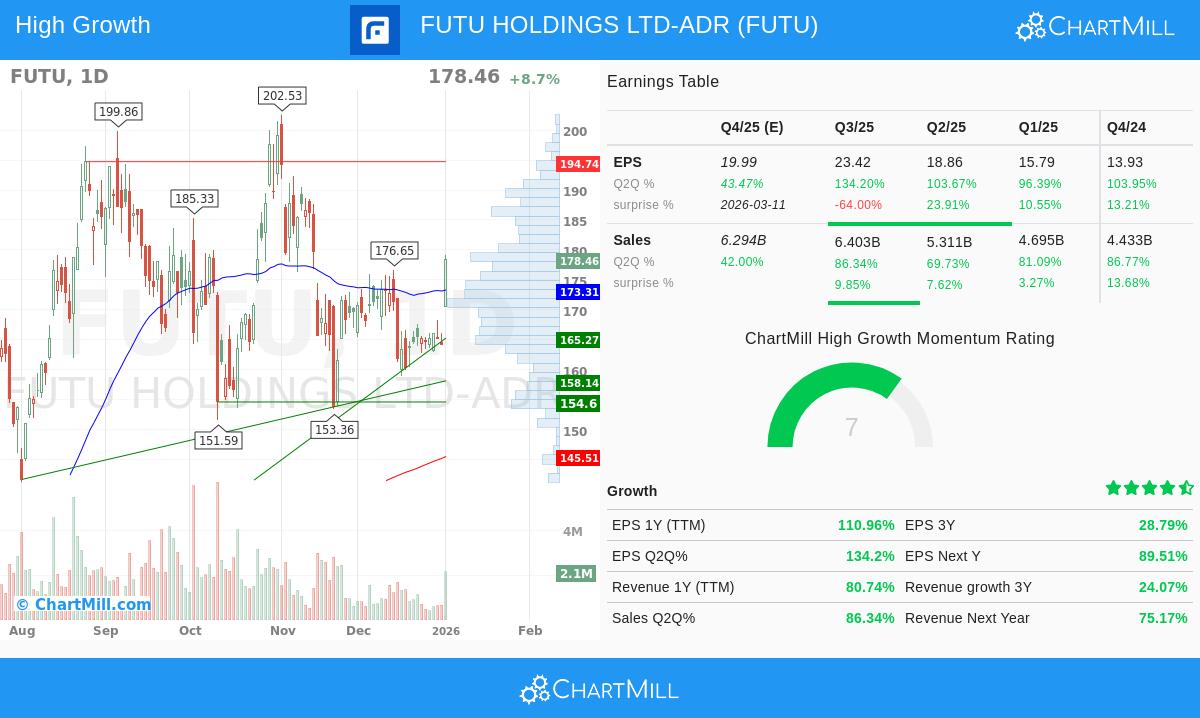
- Moving Price and Averages: The stock's price is located above all main simple moving averages (SMAs), the 50-day ($173.31), 150-day ($161.27), and 200-day ($145.51). Importantly, these averages are in the right positive order: the 50-day SMA is above the 150-day, which is above the 200-day. Also, the 200-day SMA itself is in a clear upward move, having increased from about $145.19.
- Nearness to Highs: A key point of Minervini's plan is concentrating on strength, not low price. FUTU's present price near $178.46 is more than 150% above its 52-week low of $70.60, showing strong recovery force. At the same time, it trades within about 12% of its 52-week high of $202.53, showing it is behaving like a market frontrunner, not a follower.
- Better Relative Strength: Maybe most revealing is the stock's ChartMill Relative Strength (CRS) score of 95.32. This means FUTU has done better than about 95% of all stocks in the market over the last year. Minervini notes that real leaders regularly show high relative strength, as it points to institutional interest and money flow toward the successful stock.
This technical view satisfies the "Trend" part of Minervini's SEPA system, verifying FUTU is in a Stage 2 rise, which is the main target for entry.
Fundamental Force: The Driver for Growth
While the chart shows the "what," the fundamentals clarify the "why." For a stock to maintain a strong trend, it must be pushed by outstanding business results. This is where the High Growth Momentum (HGM) score becomes important, and FUTU's basic measures show a company in a high-growth period.
- Very Strong Earnings Growth: The company's trailing twelve-month (TTM) earnings per share (EPS) has increased by about 111% year-over-year. This gain is even more clear on a quarterly basis, with the newest quarter showing EPS growth of over 134% compared to the same time last year.
- Solid and Gaining Revenue: Top-line growth is also strong. TTM revenue has grown by over 80%. Quarterly sales growth stays very high, regularly above 69% for the last few quarters, with the latest quarter up over 86%.
- Growing Profitability: Growth is not reducing margins. Actually, FUTU's profit margin has grown in order over the last four quarters, increasing from 42.2% to 50.4% in the most recent report. This shows price strength and effective operations.
- Analyst Trust: The fundamental account is getting more support from Wall Street. Analyst guesses for both next year's EPS and revenue have been adjusted higher by over 13% and 11%, in that order, in the last three months. Such upward changes often come before continued institutional purchasing.
This mix of very fast sales growth, even quicker profit growth, and increasing analyst guesses forms the strong "Fundamentals" and "Catalyst" parts needed by the Minervini SEPA plan. It indicates the solid price trend is supported by real business force.
Present Technical Review and Entry Points
According to ChartMill's separate technical study report for FUTU, the stock gets a high technical score of 9 out of 10, showing its very good long-term and short-term trend condition. The report mentions the stock is doing better than 97% of its group in the Capital Markets industry and is trading in the higher part of its 52-week range.
However, the study also gives an important note of care related to the "Entry Point" part of Minervini's way. The setup quality score is now low (1 out of 10). The report says, "Prices have been rising strongly lately, it may be a good idea to wait for a consolidation or pullback before considering an entry." This matches well with Minervini's rule of looking for lower-risk entries, often through a Volatility Contraction Pattern (VCP), instead of following extended prices. While FUTU meets the filter standards for trend and growth, a careful way would be to add it to a watchlist and wait for a better setup for entry.
You can review the full, detailed technical analysis for FUTU here.
Locating Like Chances
FUTU HOLDINGS LTD-ADR shows the kind of chance that methodical filtering can find: a company with a solid technical trend driven by very strong fundamental force. For investors wanting to use this joined Minervini and high-growth method to locate other possible candidates, the filtering steps that found FUTU can be repeated.
Disclaimer: This article is for information and learning only. It is not meant as investment guidance, a suggestion, or a bid or request to buy or sell any securities. The study of FUTU Holdings Ltd. is based on given data and should not be the only reason for any investment choice. All investing has risk, including the possible loss of the original amount. You should do your own complete research and think about talking with a skilled financial advisor before making any investment choices.