
The CAN SLIM investment methodology, created by William O'Neil, joins fundamental and technical analysis to find high-growth market leaders. This methodical process assesses companies using seven main factors represented by the letters CAN SLIM, concentrating on earnings speed, yearly growth patterns, new products or services, supply and demand forces, market leadership, institutional backing, and the general market trend. Investors applying this method look for companies with solid fundamental numbers that also display technical health via price action and institutional buying.
Current Quarterly Performance
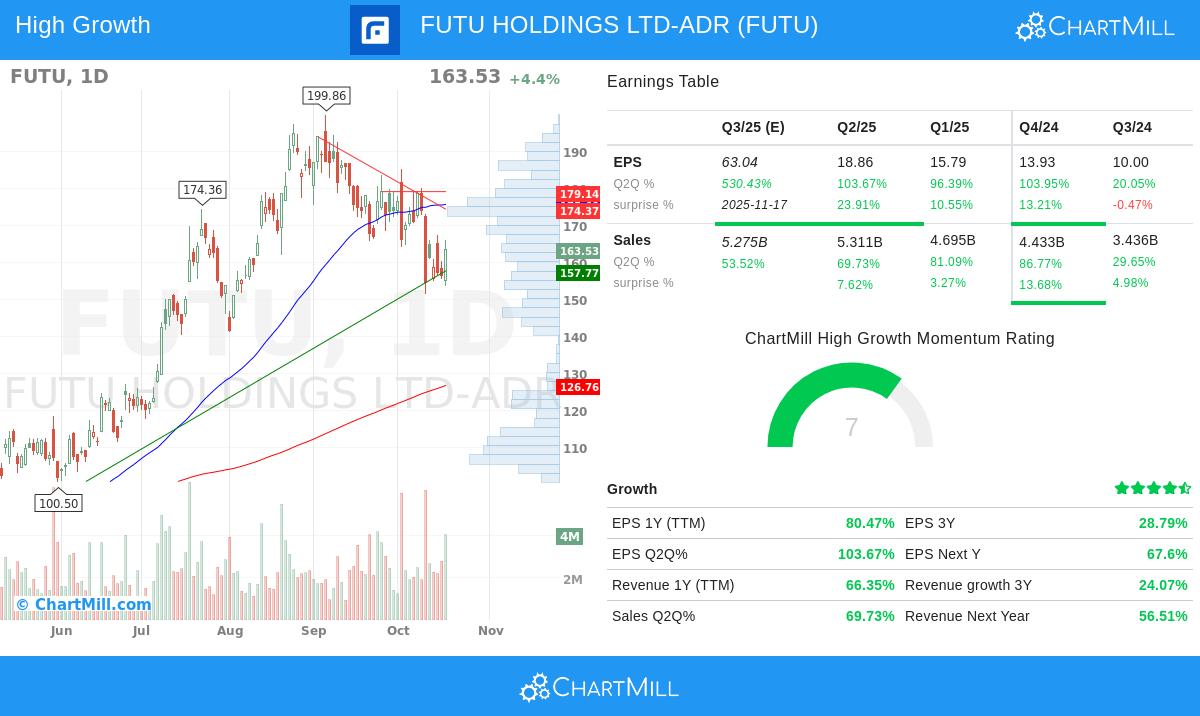
FUTU HOLDINGS LTD-ADR (NASDAQ:FUTU) shows very good recent quarterly performance that fits the "C" part in CAN SLIM, which focuses on current quarterly earnings and sales speed. The company's latest financial reports indicate:
, Quarterly EPS growth of 103.67% versus the same quarter last year , Quarterly revenue growth of 69.73% year-over-year
These numbers are much higher than O'Neil's recommended minimum of 18-20% growth, pointing to good momentum in the company's main business activities. The large earnings growth exceeding revenue growth hints at better operational effectiveness and margin improvement.
Annual Earnings Growth
The "A" part of CAN SLIM calls for steady yearly earnings gains, and FUTU performs very well here. The company has reached:
, Three-year EPS compound annual growth rate of 28.79% , Return on Equity of 23.77%, much higher than the industry average
These measures show the company's capacity to maintain growth beyond temporary surges, with ROE numbers signifying good use of shareholder money. The steady yearly growth pattern indicates a lasting business model instead of short-term success.
Technical Health and Market Position
FUTU displays several traits that meet the technical parts of CAN SLIM, especially the "N" and "L" factors focusing on market leadership and relative performance:
, Relative strength rating of 89.99, showing it performs better than almost 90% of all stocks , Good price action with 75.35% gains during the last year , Trading volume averaging 2.53 million shares daily, providing sufficient liquidity
The company's role as a digital brokerage platform fits the "new products, new services" part of the method, working in the increasing fintech sector that represents change in financial services delivery.
Financial Condition and Institutional Backing
The company satisfies several more CAN SLIM factors through its financial setup and ownership details:
, Debt-to-equity ratio of 0.28, showing careful leverage , Institutional ownership of 44.45%, within the preferred span for growing companies , Good profitability margins with operating margin of 55.82%
These measures meet the "S" and "I" factors, indicating healthy supply and demand traits and suitable institutional support without excessive ownership. The medium level of institutional ownership allows for more institutional buying as the company keeps performing.
Fundamental and Technical Evaluation
According to ChartMill's fundamental analysis report for FUTU, the company gets a rating of 6 out of 10, with specific good points in growth and profitability measures. The technical analysis report for FUTU shows a rating of 5 out of 10, mentioning that while near-term trends have softened, the longer-term trend is still good and the stock offers a possible setup chance after recent sideways movement.
Market Situation and Points to Think About
While FUTU shows good alignment with many CAN SLIM factors, investors should note that the wider market situation ("M" in CAN SLIM) displays a neutral longer-term trend for the S&P 500 with positive near-term momentum. The company's present valuation measures show a P/E ratio of 21.69, which seems fair considering its growth outlook and industry place.
Looking at Other Possibilities
For investors wanting to find other companies that fit CAN SLIM factors, more screening results can be found using the pre-set CAN SLIM screener. This tool allows for more personalization based on individual risk comfort and investment choices.
Disclaimer: This article is for informational purposes only and does not constitute investment advice, recommendation, or endorsement of any security or strategy. Investors should conduct their own research and consult with financial advisors before making investment decisions. Past performance does not guarantee future results.