
Investors looking for growth chances often deal with the task of finding companies with both good business basics and positive price momentum. One method brings these two areas together, searching for stocks that show solid financial expansion and sound operations while also displaying technical breakout shapes on their charts. This process tries to find companies set for price gains by using the confidence from fundamental soundness and the timing cues from chart study. A stock that recently appeared from this kind of search is FORTINET INC (NASDAQ:FTNT).
Fortinet offers cybersecurity answers to a wide set of businesses, from large corporations to government bodies. Its combined Fortinet Security Fabric system covers secure networking, unified Secure Access Service Edge, and AI-powered security tasks. The company's fundamental condition and expansion path are a key part of the investment idea, indicating it has the basic business caliber to maintain a possible breakout.
Fundamental Strength: The Engine for Growth
The fundamental argument for Fortinet is strong, as shown in its fundamental analysis report. The company gets an overall fundamental score of 7 out of 10, but this rating is based on outstanding results in important expansion and earnings areas. For a growth stock, the company's expansion numbers are very important, and Fortinet performs well.
- Exceptional Growth Metrics: The company displays a very solid historical expansion path. Over the last year, Earnings Per Share rose by a notable 34.90%, while Revenue went up by 14.46%. More significantly, the long-term pattern is strong, with EPS increasing at an average yearly speed of 36.84% and Revenue at 22.46% over recent years.
- Superior Profitability: Fortinet gets a high-level profitability score of 9 out of 10. Important margins are some of the best in the software field, including a Profit Margin of 30.60% and a Return on Invested Capital of 29.24%. This shows the company is not only expanding, but expanding in a productive and profitable way.
- Solid Financial Health: With a health score of 8 out of 10, the company's financial position is sound. It has a good Debt-to-Equity ratio of 0.24 and an Altman-Z score of 5.98, showing no short-term failure danger. This financial steadiness is key for a growth company to support its expansion without too much debt.
These fundamental traits are the base of the search plan. Solid expansion makes sure the company is increasing its earnings base, high profitability points to a lasting competitive edge, and good financial health gives the strength to handle market declines. Without this fundamental soundness, a technical breakout might not last.
Technical Setup: A Pattern of Potential
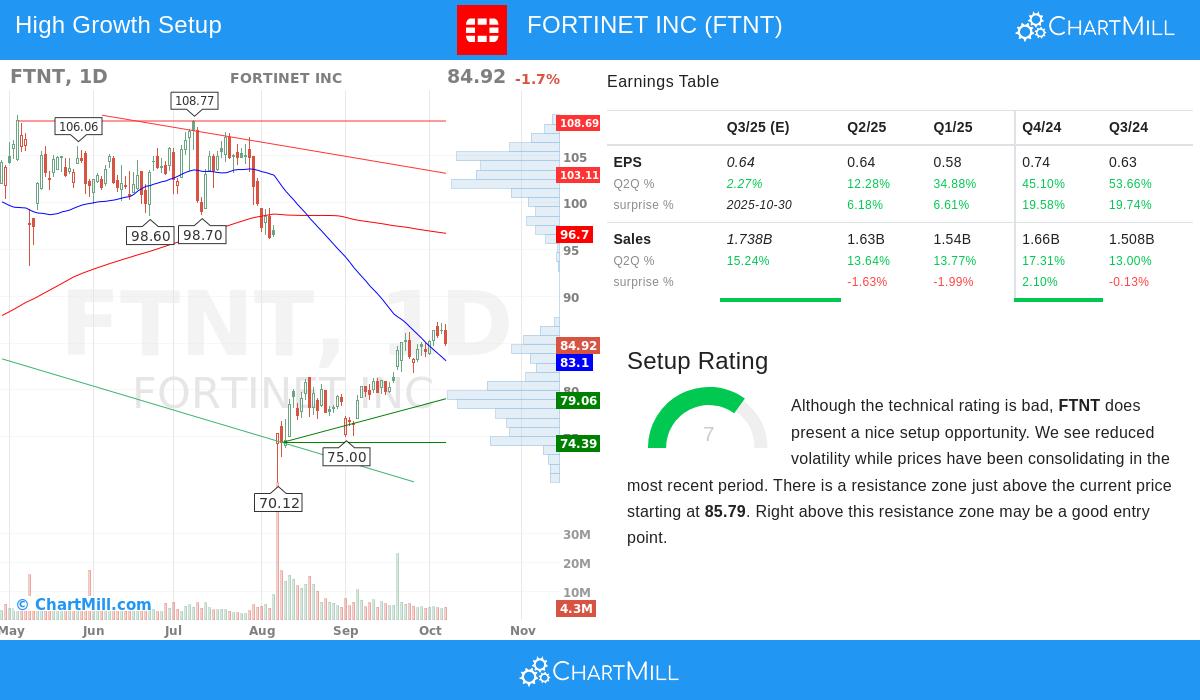
While the long-term chart-based pattern for Fortinet is still negative, recent price behavior has shown positive signals that match the search rules. The technical analysis report points out a setup score of 7 out of 10, suggesting a possibly good entry point is forming.
- Consolidation and Reduced Volatility: The stock has been changing hands in a set band between about $78.90 and $87.24 over the past month. This time of consolidation after a previous downward pattern frequently comes before a major price change.
- Key Resistance Level: A clear resistance area is present just above the present price, beginning at $85.79. This area is made from a mix of trendlines and significant moving averages. A clear breakout above this point could show a change in momentum and draw more buyer attention.
- Positive Short-Term Trend: The short-term pattern has become positive, hinting the stock is starting to be valued by traders once more. It is now trading close to the top of its recent band, testing the upper limits of its consolidation shape.
This technical view is exactly what the plan looks for: a fundamentally sound stock that is coming out of a time of price consolidation and is placed to test important resistance points. The mix indicates that the market could be starting to see the basic value and expansion possibility, possibly resulting in a continued upward movement.
Valuation Context
Fortinet's valuation shows a varied image, which is typical for high-expansion companies. It has a Valuation score of 4 out of 10. Its Price-to-Earnings ratio of 32.79 is higher than the S&P 500 average, which might be seen as costly on its own. However, measured against its industry counterparts in the software sector, Fortinet is valued more affordably than a large number of them. This comparative valuation, when looked at next to its better profitability and expansion speeds, could support its higher price for investors centered on long-term share price growth.
Conclusion
Fortinet stands as a strong example of a stock that fits the requirements of a joined fundamental and technical search. Its fast historical expansion, top-level profitability, and very sound financial health give a solid base. Technically, it is showing a hopeful setup, consolidating after a drop and nearing an important resistance point that, if passed, could mean a return of positive momentum. For investors, this coming together of elements suggests a company with the basic quality to support a continued rise, now displaying early technical signals that such a movement might be starting.
This study was built on a search for "Strong Growth Stocks with good Technical Setup Ratings." You can locate more investment options that fit this particular plan by using the pre-configured stock screener.
Disclaimer: This article is for informational purposes only and does not constitute financial advice, a recommendation to buy or sell any security, or an offer to solicit any transaction. All investments involve risk, including the possible loss of principal. You should conduct your own research and consult with a qualified financial advisor before making any investment decisions.