
For investors looking for a disciplined, long-term method to construct a portfolio, few strategies are as respected as Peter Lynch’s approach. The famous manager of the Fidelity Magellan Fund supported investing in what you understand, concentrating on companies with clear operations, maintainable growth, and fair valuations. His system is often called a "growth at a reasonable price" (GARP) strategy, which steers clear of the limits of speculative growth investing and strict bargain hunting. Instead, it looks for companies increasing earnings consistently while keeping sound financial condition, all selling at a price that does not overvalue that future prospect. A filter based on Lynch's main ideas recently highlighted TechnipFMC PLC (NYSE:FTI) as a candidate for more examination.
Examining TechnipFMC With Lynch's Measures
Peter Lynch’s filter stresses a number of important financial measures to find companies that are growing profitably without too much risk or high price. TechnipFMC, a top energy service company specializing in subsea and surface technologies, seems to match several of these central ideas.
- Maintainable Earnings Growth: Lynch preferred companies with a steady, but not extreme, growth path. He usually sought a 5-year earnings per share (EPS) growth rate from 15% to 30%. TechnipFMC’s EPS has increased at an average yearly rate of about 25% over the last five years, putting it directly within this desired zone. This points to a record of controlled, maintainable increase rather than irregular fast growth.
- Fair Valuation (PEG Ratio): Possibly the central part of the GARP method is the Price/Earnings to Growth (PEG) ratio, which Lynch stated should be at or under 1. This measure modifies the standard P/E ratio for the company's growth rate, aiding in finding stocks that might be priced low compared to their growth possibility. TechnipFMC’s PEG ratio, calculated from its past five-year growth, is about 0.78. A number below 1 shows that, historically, the market may not be completely valuing the company’s earnings growth, a good sign under this strategy.
- High Profitability (Return on Equity): Lynch demanded a high return on equity (ROE) as a mark of a well-run company that produces good profits from shareholder capital. He set a minimum level of 15%. TechnipFMC greatly passes this standard with an ROE of 28.4%, showing better profitability in its field.
- Financial Condition (Debt & Liquidity): A careful balance sheet was key for Lynch. He liked companies financed more by equity than debt, often looking for a Debt-to-Equity ratio under 0.6 (and preferably under 0.25). TechnipFMC’s ratio of approximately 0.14 shows a very careful capital structure with little debt use. For liquidity, the filter needs a Current Ratio of at least 1, making sure the company can meet near-term duties. TechnipFMC meets this basic level with a ratio of 1.13.
A View of Fundamental Condition
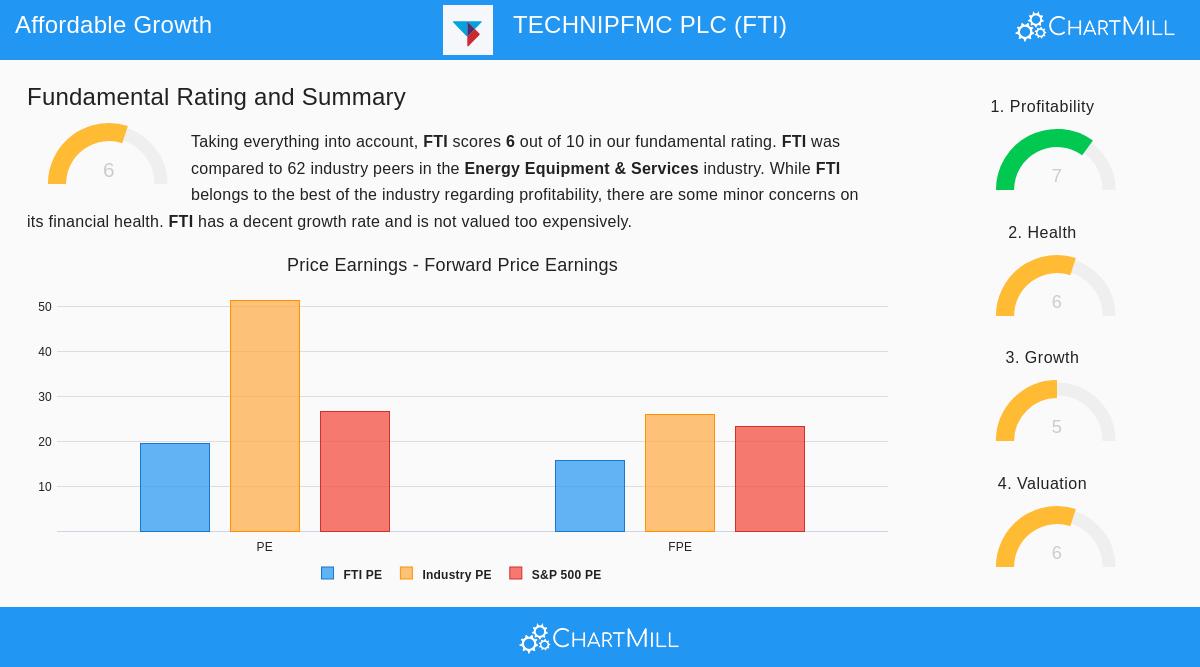
Outside the specific filter rules, a wider look at TechnipFMC’s fundamental profile shows a varied but mostly firm picture. The company gets a fundamental rating of 6 out of 10, meaning it is a fair candidate when compared to similar companies in the Energy Equipment & Services industry.
- Profitability is a definite positive, with high marks for Return on Equity and Return on Invested Capital (ROIC). Margins have displayed progress in recent years.
- Valuation offers a detailed perspective. While the standard P/E ratio seems somewhat high alone, it looks more appealing compared to the industry and the wider S&P 500. The strong PEG ratio, as mentioned, helps explain the valuation considering the company's growth.
- Financial condition scores are acceptable but note an area for attention. The company’s solvency is firm, helped by its low debt amounts. However, liquidity measures like the Quick Ratio are lower compared to industry peers, which may need observation for long-term investors.
- Growth is firm historically, with notable past EPS and revenue gains. Analyst forecasts indicate continued, though somewhat slower, earnings growth in the coming years.
For a complete look at these measures, you can see the full fundamental analysis report for FTI.
Investment Points and Setting
While the filter finds good numerical characteristics, Peter Lynch always highlighted the need for qualitative understanding. For TechnipFMC, this means thinking about its place in the shifting energy environment. The company’s focus on subsea engineering and technology is important for both standard offshore oil and gas projects and new energy areas. Investors should study the company’s order backlog, its competitive position against others, and how it is changing to the global shift in energy spending. The "simple" character of its industrial business might have interested Lynch, but knowing the cycles and project-based income of the energy services field is necessary.
TechnipFMC’s match with several Lynch ideas, maintainable historical growth, a strong PEG ratio, high profitability, and a careful balance sheet, makes it a notable candidate for investors using a GARP strategy. It acts as a clear example of how methodical filtering can find companies that satisfy strict, proven investment standards.
Interested in finding other companies that pass the Peter Lynch filter? You can locate the full, current list of qualifying stocks by going to the Peter Lynch Strategy Screener.
,
Disclaimer: This article is for informational purposes only and does not constitute financial advice, a recommendation, or an offer or solicitation to buy or sell any securities. The analysis is based on data and a specific investment strategy filter, it is not a substitute for your own research and due diligence. Investing involves risk, including the potential loss of principal. You should consider your own financial situation, investment objectives, and risk tolerance before making any investment decision.