
For investors looking to find stocks with high potential for major growth, joining a strict technical system with a focus on fundamental momentum can be an effective method. One example is the Mark Minervini strategy, which brings together his specific Trend Template with a detailed study of earnings and sales speed. The aim is to locate companies not just in a strong technical uptrend but also showing the fundamental "super-performance" that frequently comes before large price gains. A filter made to find these traits, the 'High Growth Momentum + Trend Template', looks for stocks that meet Minervini's exact technical list while also displaying solid, speeding growth measures.
FTC Solar Inc (NASDAQ:FTCI) appears as a candidate from this filter process. The Austin-based provider of solar tracker systems and engineering services has displayed notable price movement, matching the strict standards growth and momentum investors focus on.
Reviewing the Technical Base: The Minervini Trend Template
Mark Minervini's Trend Template is a group of fixed technical rules made to sort for stocks in a verified, strong uptrend. It focuses on price trading above important moving averages, with those averages ordered positively, and the stock displaying leadership through high relative strength. FTCI presently fits these strict technical requirements:
- Price vs. Moving Averages: The stock's last price of $11.90 trades well above its rising 50-day ($9.85), 150-day ($7.38), and 200-day ($6.35) simple moving averages (SMAs). This meets the main template rule that price must be above all three averages.
- Moving Average Order: The shorter-term 50-day SMA ($9.85) is placed above both the 150-day ($7.38) and 200-day ($6.35) SMAs. Also, the 150-day SMA also trades above the 200-day SMA. This "ordered" setup confirms a built uptrend across several timeframes, a main point of the Minervini method that shows continued buying pressure.
- Nearness to Highs: At $11.90, FTCI is trading within 6.3% of its 52-week high of $12.70. Minervini's strategy concentrates on strength, not weakness, favoring stocks close to new highs as they are frequently market leaders. At the same time, the price is about 459% above its 52-week low of $2.13, showing a strong recovery trend.
- Relative Strength Leadership: With a ChartMill Relative Strength (CRS) score of 97.31, FTCI is doing better than nearly 98% of all stocks in the market. This outstanding relative strength is a foundation of the strategy, finding securities that are wanted and leading the market higher, no matter of sector or index movements.
This technical view shows why FTCI passed the first Trend Template filter. The strategy suggests that such order often comes before more price gains, as it shows institutional buying and a lack of overhead supply.
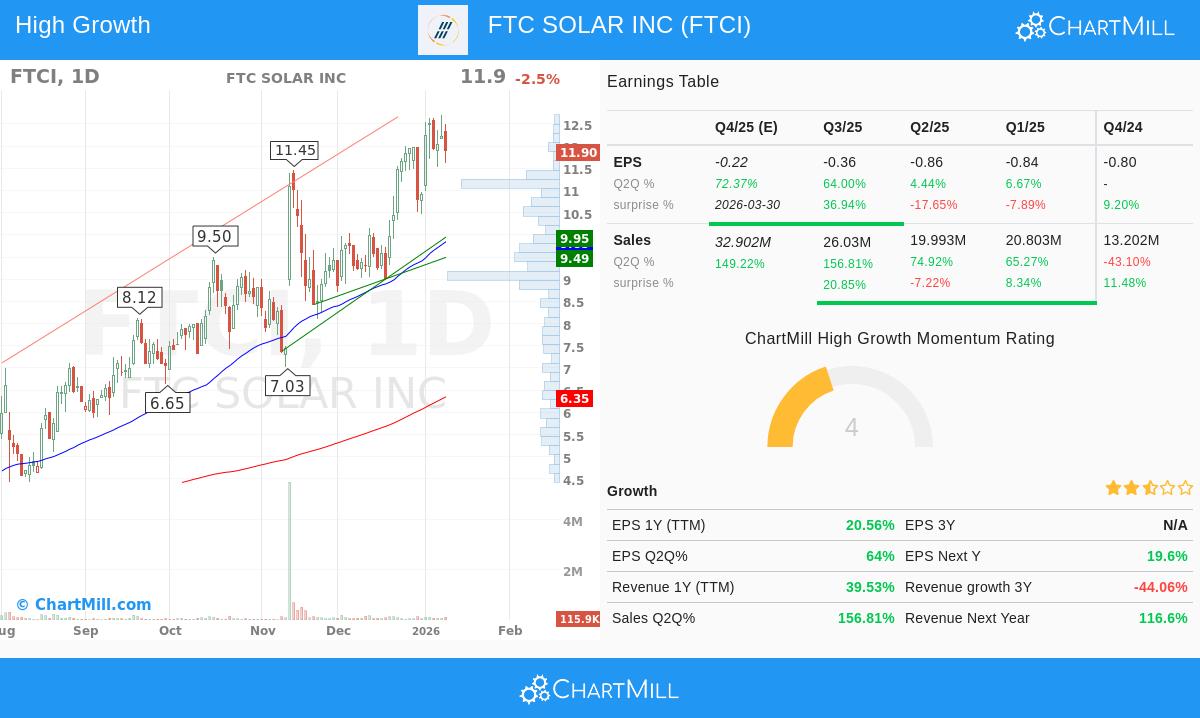
Reviewing the Growth Driver: High Growth Momentum (HGM)
While a solid chart is necessary, the Minervini idea states that the largest winners are driven by fundamental speed. The "High Growth Momentum" part of the filter searches for signs of better business results, especially in earnings and sales. FTCI shows several strong data points:
- Large Sales Momentum: The most recent quarter had year-over-year revenue growth of 156.8%. This comes after earlier quarter growth rates of 74.9% and 65.3%, showing a strong and speeding sales trend. For the next quarter, analysts forecast sales growth of 149.2%. This path is important, as Minervini states that increasing sales often draw institutional interest and can be a main driver for stock performance.
- Earnings Improvement: The company is on a clear path toward profit gain. The latest quarter showed EPS growth of 64.0% year-over-year. While the company is not yet profitable on a trailing twelve-month (TTM) basis, the step-by-step gain in quarterly earnings is a positive sign that operational performance is matching top-line growth.
- Analyst Forecasts and Changes: The stock has a record of beating forecasts, with revenue surprises in 3 of the last 4 quarters, averaging an 8.36% beat. Importantly, analysts have changed their next-year revenue estimates higher by 11.87% over the last three months, showing increasing belief in the company's future sales. While next-year EPS estimates have been reduced, the major strength in sales changes and actual results is a notable positive point for growth investors.
This mix of very high sales growth, improving earnings trends, and positive estimate changes matches the "high growth momentum" looked for by the filter. It indicates the company has a fundamental driver that can maintain the technical uptrend found by the Trend Template.
Technical Condition and Setup Review
Beyond the specific template rules, a wider technical study of FTC Solar gives more background. According to ChartMill's automated technical report, FTCI receives a complete Technical Rating of 10/10. This score shows its steady outperformance, positive long-term and short-term trends, and leadership inside the Electrical Equipment industry (doing better than 92% of its peers).
The report states the stock is currently showing a bull flag pattern, a pause or small drop after a strong rise, which can sometimes give a possible entry point within a continuing uptrend. However, with a Setup Quality rating of 4, the report indicates that recent price movement has been somewhat unstable, making a perfect, low-risk entry point less defined at this exact time. Investors following a strict method may look for a tighter consolidation to form.
For a detailed look at support levels, trend study, and the full technical view, you can see the complete ChartMill Technical Report for FTCI.
A Candidate for More Study
FTC Solar Inc presents a case where a strong technical breakout, as described by the Minervini Trend Template, lines up with strong fundamental momentum in its core business operations. The stock's leadership status (high relative strength), ordered moving averages, and nearness to highs show the image of a leading trend. This is backed by speeding revenue growth and positive business momentum that growth investors look for.
It acts as a real example of how joining technical trend-following rules with fundamental growth filtering can find possible opportunities. As with any investment method, this finding is the first step, needing more research on the company's competitive place, market conditions, and overall risk management.
Interested in locating other stocks that fit this mix of solid technical trends and high growth momentum? You can use the same filter with this link: High Growth Momentum + Trend Template Screen.
Disclaimer: This article is for informational and educational reasons only. It is not a suggestion to buy or sell any security. The study is based on data given and filtering methods described. All investing includes risk, including the possible loss of principal. You should do your own research and think about talking with a qualified financial professional before making any investment decisions.