
FTC SOLAR INC (NASDAQ:FTCI) was recently found using a screening method that joins Mark Minervini's strict Trend Template with criteria for strong growth momentum. This combined method aims to find companies displaying both solid technical price trends and improving fundamental growth, traits often seen in stocks before they experience large price gains. The method supports buying into strength instead of pursuing weakness, concentrating on securities that are already in clear uptrends while also indicating better business fundamentals.
Technical Strength: Meeting the Minervini Trend Template
The Minervini Trend Template offers an organized structure for finding stocks in solid uptrends, and FTCI currently meets its main technical conditions:
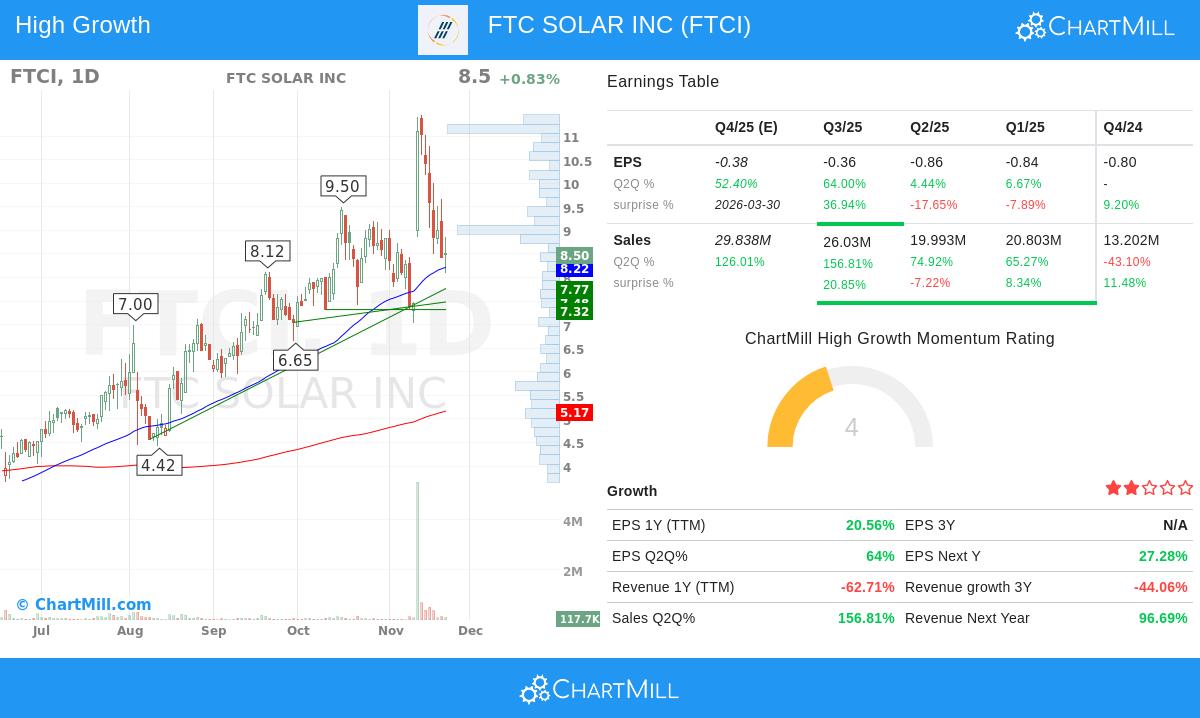
- Price Above Key Moving Averages: The stock is at $8.50, located above its increasing 50-day ($8.22), 150-day ($5.93), and 200-day ($5.17) simple moving averages. This arrangement verifies the stock is in a continuing bull market phase across short, medium, and long-term periods.
- Moving Average Arrangement: The 50-day SMA is positioned above both the 150-day and 200-day SMAs, and the 150-day SMA is also above the 200-day SMA. This ordered, upward-sloping formation is a typical indicator of building momentum and buyer control.
- Nearness to Highs: The present price is about 78% higher than its 52-week low of $2.13 and is less than 25% away from its 52-week high of $11.45. This shows the stock has solid momentum without being too far from its recent high point.
- Strong Relative Strength: With a ChartMill Relative Strength (CRS) rating of 96.19, FTCI is performing better than 96% of all stocks. Minervini frequently points out that market leaders—the stocks most likely to produce large returns—almost always show high relative strength scores, usually above 70 and preferably in the 80s or 90s.
Fundamental Momentum: Qualifying as a High-Growth Candidate
In addition to a technically positive chart, FTCI shows several fundamental features that interest growth investors. The company's recent operational results suggest a possible turning point.
- Strong Quarterly Sales Growth: The latest quarter had revenue increase by 156.8% versus the same quarter last year. This is a large improvement over the prior quarter's growth of 74.9%. Such significant sales growth is a vital part of the Minervini method, as it frequently serves as a trigger that draws institutional buying and leads to notable price increases.
- Notable Earnings Path: The company's earnings per share (EPS) for the last quarter increased by 64% year-over-year. While the trailing twelve-month (TTM) EPS is still negative, the clear positive shift in quarterly profit is a solid indication that the business could be reaching a size where operational efficiency is starting to work.
- Positive Estimate Changes for the Short Term: Analysts are forecasting EPS growth of 52.4% for the next quarter. While estimates for further out have been adjusted lower, the positive short-term view adds to the argument for current operational progress.
Putting It All Together: The Technical Health Overview
The technical analysis report for FTCI gives the stock a high score of 8 out of 10, reflecting its solid technical condition. The report mentions a steady general performance and a good long-term direction, even with some recent sideways movement. It also finds an acceptable setup pattern, with prices moving in a range and volatility lessening, which can sometimes come before a new upward move. Important support levels are noted between $7.32 and $7.48, offering a clear technical point for managing risk.
Finding Similar Opportunities
For investors looking for other companies that match this description of solid technical trends combined with high growth momentum, the screening method that found FTCI can be a useful instrument. You can locate more potential options by using the High Growth Momentum + Trend Template screen on ChartMill.
Disclaimer: This is not investment advice. The content is intended for information and education purposes only. It is crucial to conduct your own research and consider your financial situation and risk tolerance before making any investment decisions. Please read our full disclaimer and terms of use to understand our obligations.