
For investors looking to assemble a portfolio of durable, well-run companies able to increase wealth over time, the ideas of quality investing provide a useful structure. This method centers on finding businesses with lasting competitive strengths, good profitability, steady expansion, and sound finances. One organized way to find these companies is the "Caviar Cruise" stock screen, which uses a set of numerical filters to search for these high-grade attributes. The screen stresses past revenue and profit expansion, high returns on invested capital, reasonable debt amounts, and the skill to turn accounting profits into actual cash flow.
A recent search using this process has identified FirstService Corp. (NASDAQ:FSV) as a candidate for more detailed review. The Toronto-based company, working through its FirstService Residential property management and FirstService Brands service networks, seems to display a number of features that match the quality investing view.
Matching the Main Quality Standards
The Caviar Cruise screen uses a detailed set of filters, and FirstService's financial picture shows a good match with the main needs.
-
Lasting Expansion: The screen asks for at least a 5% compound annual growth rate (CAGR) for both revenue and EBIT (earnings before interest and taxes) over five years. FirstService easily passes this, with a revenue CAGR of 5.15% and a more notable EBIT CAGR of 16.98%. Importantly, EBIT expansion exceeding revenue expansion—as seen here—is a main screen filter. This points to better operational efficiency and possible pricing strength, meaning the company is not only getting larger but also more profitable as it grows.
-
Outstanding Capital Use: A central part of quality investing is a company's skill to produce high returns on the capital it uses. The screen needs a Return on Invested Capital (leaving out cash, goodwill, and intangibles) over 15%. FirstService reports a solid ROICexgc of 23.97%, showing that management is very good at using capital to create profits. This measure is important because it indicates if a business has a real competitive edge that lets it earn above-average returns.
-
Good Financial Condition and Cash Flow: Quality companies should not carry too much debt. The screen uses the Debt-to-Free Cash Flow (FCF) ratio, looking for a number under 5, which shows how many years it would take to pay off all debt using current FCF. FirstService's ratio of 4.18 fits within this acceptable area, reflecting a debt level that is not too high compared to its cash production. Also, the screen checks for "quality" profits by needing a 5-year average Profit Quality (FCF/Net Income) over 75%. FirstService's number of 141.74% is very good, meaning it produces much more free cash flow than its accounting net income. This gives great financial room for dividends, share repurchases, reinvestment, or strategic purchases.
Basic Analysis Summary
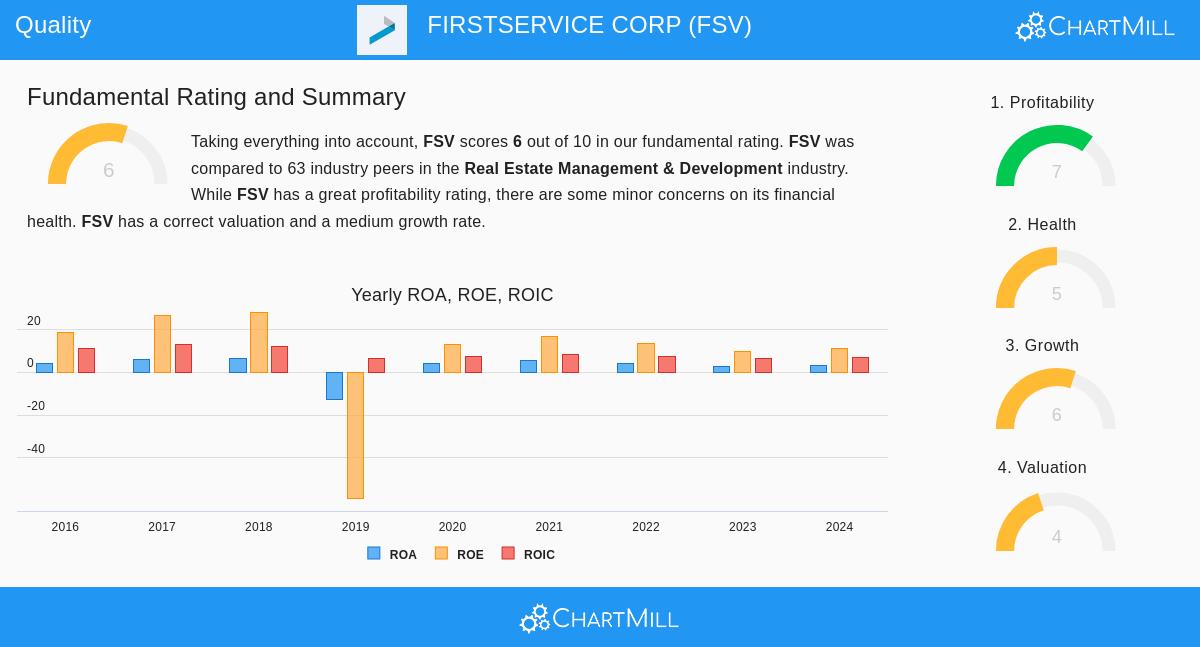
A look at FirstService's detailed basic report gives the company a total score of 6 out of 10, noting its positive points and items to think about compared to its Real Estate Management & Development industry group.
- Profitability is a definite positive point, with a score of 7. The company does well on Return on Equity (10.34%) and Return on Invested Capital (7.35%), doing better than most of its industry. Margins are generally above industry averages, though the report mentions some recent softness in the Profit Margin.
- Expansion measures are good, with a score of 6. The company has shown strong past growth in both Earnings Per Share (10.76% CAGR) and Revenue (16.73% CAGR). Analyst forecasts point to continued, though more measured, growth in the near future.
- Financial Condition gets a middle score of 5. The company's Altman-Z score shows low bankruptcy risk, and the Debt/FCF ratio is better than most peers. However, the report notes a rise in shares outstanding over time and a Debt-to-Equity ratio that is higher than many in the industry.
- Valuation is scored a 4. While FirstService's Price-to-Earnings ratio of 27.27 is close to the S&P 500 average and lower than many industry peers, the report still calls it "quite expensive" on its own. Its Enterprise Value/EBITDA and Price/Free Cash Flow ratios, however, seem more appealing relative to the industry.
Investment Points for the Quality View
For an investor using a quality-focused, long-term strategy, FirstService shows an interesting profile. Its main business—necessary property services and residential management—displays features quality investors often want: demand that holds up in downturns, a split-up market allowing for consolidation, and the chance for lasting competitive strengths through size and brand awareness in its franchise networks. The good cash conversion and high ROIC suggest a business model that can steadily pay for its own growth and benefit shareholders.
Still, the quality investing method also includes a non-numerical review. Investors would need to judge the company's long-term competitive edge, the skill of its management, and its link to economic cycles. The present valuation, while not too high relative to its own quality measures, needs a long-term belief in the company's growth path to be reasonable.
Finding Other Quality Candidates
FirstService Corp. came from a specific search made to find companies with quality features. Investors wanting to see the complete list of companies that pass this Caviar Cruise screen, or to adjust the filters for their own study, can view the screen here.
Disclaimer: This article is for information only and is not financial advice, a suggestion, or an offer to buy or sell any security. Investing has risk, including the possible loss of your original investment. You should do your own complete study and talk with a qualified financial advisor before making any investment choices.