
Take a closer look at FOX CORP - CLASS B (NASDAQ:FOX), a remarkable value stock uncovered by our stock screener. FOX excels in fundamentals and maintains a very reasonable valuation. Let's break it down further.
Deciphering FOX's Valuation Rating
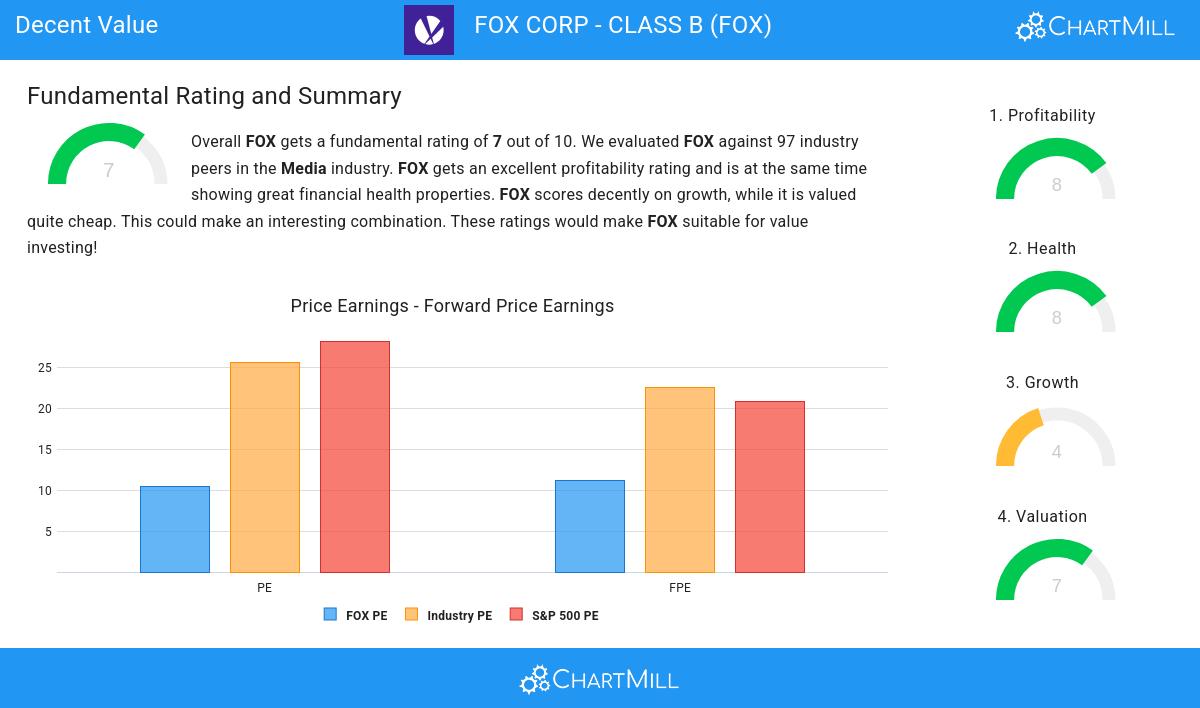
An integral part of ChartMill's stock analysis is the Valuation Rating, which spans from 0 to 10. This rating evaluates diverse valuation factors, including price to earnings and cash flows, while considering the stock's profitability and growth. FOX has received a 7 out of 10:
- The Price/Earnings ratio is 10.49, which indicates a very decent valuation of FOX.
- 78.35% of the companies in the same industry are more expensive than FOX, based on the Price/Earnings ratio.
- The average S&P500 Price/Earnings ratio is at 28.18. FOX is valued rather cheaply when compared to this.
- FOX is valuated reasonably with a Price/Forward Earnings ratio of 11.18.
- Based on the Price/Forward Earnings ratio, FOX is valued a bit cheaper than 77.32% of the companies in the same industry.
- FOX's Price/Forward Earnings ratio indicates a valuation a bit cheaper than the S&P500 average which is at 20.81.
- Based on the Enterprise Value to EBITDA ratio, FOX is valued a bit cheaper than 67.01% of the companies in the same industry.
- Based on the Price/Free Cash Flow ratio, FOX is valued a bit cheaper than the industry average as 72.16% of the companies are valued more expensively.
- The low PEG Ratio(NY), which compensates the Price/Earnings for growth, indicates a rather cheap valuation of the company.
- FOX has an outstanding profitability rating, which may justify a higher PE ratio.
A Closer Look at Profitability for FOX
ChartMill utilizes a Profitability Rating to assess stocks, scoring them on a scale of 0 to 10. This rating takes into account a variety of profitability ratios and margins, both in absolute terms and in comparison to industry peers. FOX has earned a 8 out of 10:
- FOX has a Return On Assets of 9.49%. This is amongst the best in the industry. FOX outperforms 92.78% of its industry peers.
- FOX has a Return On Equity of 19.01%. This is amongst the best in the industry. FOX outperforms 90.72% of its industry peers.
- With an excellent Return On Invested Capital value of 11.45%, FOX belongs to the best of the industry, outperforming 93.81% of the companies in the same industry.
- The Average Return On Invested Capital over the past 3 years for FOX is above the industry average of 6.63%.
- The 3 year average ROIC (10.04%) for FOX is below the current ROIC(11.45%), indicating increased profibility in the last year.
- FOX's Profit Margin of 14.39% is amongst the best of the industry. FOX outperforms 91.75% of its industry peers.
- FOX has a Operating Margin of 20.37%. This is amongst the best in the industry. FOX outperforms 91.75% of its industry peers.
Health Analysis for FOX
ChartMill assigns a proprietary Health Rating to each stock. The score is computed by evaluating various liquidity and solvency ratios and ranges from 0 to 10. FOX was assigned a score of 8 for health:
- The Altman-Z score of FOX (2.69) is better than 82.47% of its industry peers.
- The Debt to FCF ratio of FOX is 3.92, which is a good value as it means it would take FOX, 3.92 years of fcf income to pay off all of its debts.
- FOX's Debt to FCF ratio of 3.92 is amongst the best of the industry. FOX outperforms 81.44% of its industry peers.
- A Current Ratio of 2.50 indicates that FOX has no problem at all paying its short term obligations.
- Looking at the Current ratio, with a value of 2.50, FOX is in the better half of the industry, outperforming 77.32% of the companies in the same industry.
- FOX has a Quick Ratio of 2.14. This indicates that FOX is financially healthy and has no problem in meeting its short term obligations.
- With a decent Quick ratio value of 2.14, FOX is doing good in the industry, outperforming 72.16% of the companies in the same industry.
How do we evaluate the Growth for FOX?
ChartMill assigns a Growth Rating to every stock. This score ranges from 0 to 10 and evaluates the different growth aspects like EPS and Revenue, both in the past as in the future. FOX scores a 4 out of 10:
- The Earnings Per Share has grown by an impressive 35.38% over the past year.
- FOX shows quite a strong growth in Earnings Per Share. Measured over the last years, the EPS has been growing by 8.16% yearly.
Our Decent Value screener lists more Decent Value stocks and is updated daily.
Check the latest full fundamental report of FOX for a complete fundamental analysis.
Disclaimer
Important Note: The content of this article is not intended as trading advice. It is essential to perform your own analysis and exercise caution when making trading decisions. The article presents observations created by automated analysis but does not guarantee any trading or investment outcomes. Always trade responsibly and make independent judgments.