
FOX CORP - CLASS B (NASDAQ:FOX) is a hidden gem identified by our stock screening tool, featuring undervaluation and robust fundamentals. FOX showcases decent financial health and profitability, coupled with an attractive price. Let's dig deeper into the analysis.
Valuation Assessment of FOX
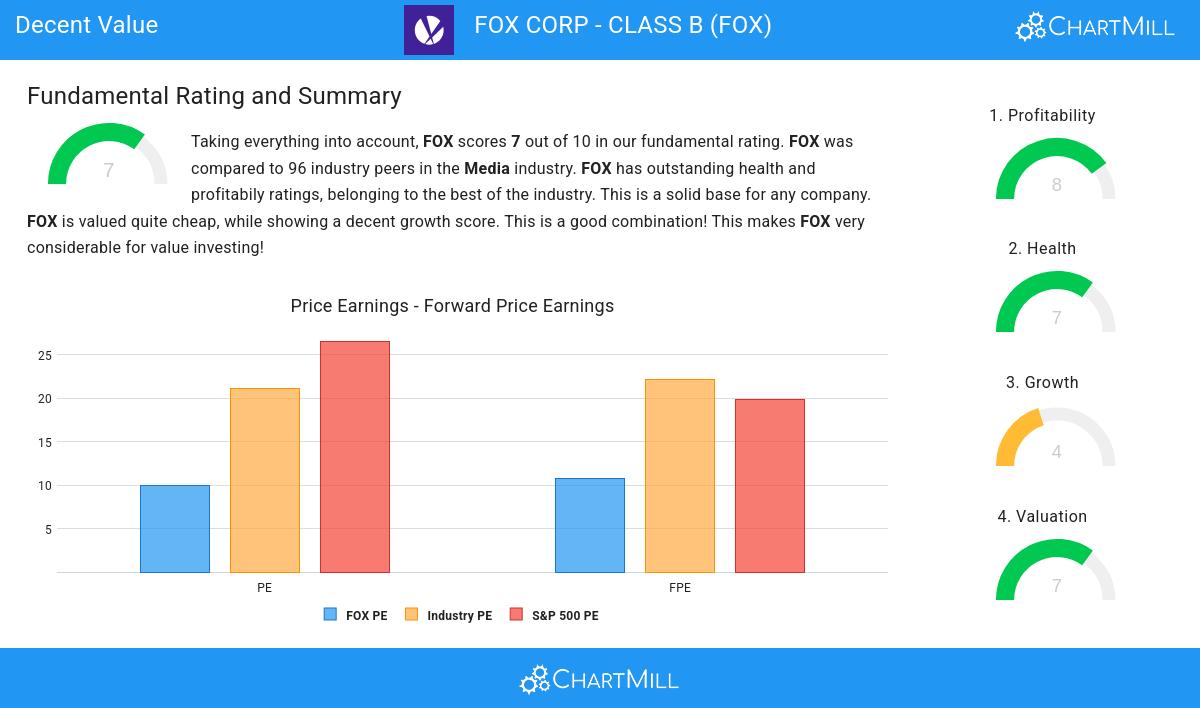
ChartMill employs its own Valuation Rating system for all stocks. This score, ranging from 0 to 10, is determined by evaluating different valuation factors, including price to earnings and free cash flow, both in absolute terms and relative to the market and industry. FOX has earned a 7 for valuation:
- With a Price/Earnings ratio of 9.96, the valuation of FOX can be described as very reasonable.
- Based on the Price/Earnings ratio, FOX is valued a bit cheaper than the industry average as 76.04% of the companies are valued more expensively.
- FOX's Price/Earnings ratio indicates a rather cheap valuation when compared to the S&P500 average which is at 26.55.
- A Price/Forward Earnings ratio of 10.76 indicates a reasonable valuation of FOX.
- Compared to the rest of the industry, the Price/Forward Earnings ratio of FOX indicates a somewhat cheap valuation: FOX is cheaper than 75.00% of the companies listed in the same industry.
- When comparing the Price/Forward Earnings ratio of FOX to the average of the S&P500 Index (19.83), we can say FOX is valued slightly cheaper.
- Compared to the rest of the industry, the Enterprise Value to EBITDA ratio of FOX indicates a somewhat cheap valuation: FOX is cheaper than 64.58% of the companies listed in the same industry.
- Based on the Price/Free Cash Flow ratio, FOX is valued a bit cheaper than 67.71% of the companies in the same industry.
- FOX's low PEG Ratio(NY), which compensates the Price/Earnings for growth, indicates a rather cheap valuation of the company.
- FOX has an outstanding profitability rating, which may justify a higher PE ratio.
Evaluating Profitability: FOX
ChartMill's Profitability Rating offers a unique perspective on stock analysis, providing scores from 0 to 10. These ratings consider a wide range of profitability metrics and margins, both in comparison to industry peers and on their own merits. For FOX, the assigned 8 is a significant indicator of profitability:
- FOX's Return On Assets of 9.49% is amongst the best of the industry. FOX outperforms 91.67% of its industry peers.
- With an excellent Return On Equity value of 19.01%, FOX belongs to the best of the industry, outperforming 89.58% of the companies in the same industry.
- Looking at the Return On Invested Capital, with a value of 11.45%, FOX belongs to the top of the industry, outperforming 92.71% of the companies in the same industry.
- FOX had an Average Return On Invested Capital over the past 3 years of 10.04%. This is above the industry average of 6.94%.
- The last Return On Invested Capital (11.45%) for FOX is above the 3 year average (10.04%), which is a sign of increasing profitability.
- The Profit Margin of FOX (14.39%) is better than 90.63% of its industry peers.
- FOX has a better Operating Margin (20.37%) than 90.63% of its industry peers.
Health Insights: FOX
ChartMill assigns a Health Rating to every stock. This score ranges from 0 to 10 and evaluates the different health aspects like liquidity and solvency, both absolutely, but also relative to the industry peers. FOX scores a 7 out of 10:
- Looking at the Altman-Z score, with a value of 2.63, FOX belongs to the top of the industry, outperforming 84.38% of the companies in the same industry.
- The Debt to FCF ratio of FOX is 3.92, which is a good value as it means it would take FOX, 3.92 years of fcf income to pay off all of its debts.
- Looking at the Debt to FCF ratio, with a value of 3.92, FOX is in the better half of the industry, outperforming 79.17% of the companies in the same industry.
- A Current Ratio of 2.50 indicates that FOX has no problem at all paying its short term obligations.
- Looking at the Current ratio, with a value of 2.50, FOX is in the better half of the industry, outperforming 78.13% of the companies in the same industry.
- A Quick Ratio of 2.14 indicates that FOX has no problem at all paying its short term obligations.
- With a decent Quick ratio value of 2.14, FOX is doing good in the industry, outperforming 70.83% of the companies in the same industry.
Growth Examination for FOX
A key component of ChartMill's stock assessment is the Growth Rating, which spans from 0 to 10. This rating evaluates diverse growth factors, such as EPS and revenue growth, considering both past performance and future projections. FOX has received a 4 out of 10:
- FOX shows a strong growth in Earnings Per Share. In the last year, the EPS has been growing by 35.38%, which is quite impressive.
- The Earnings Per Share has been growing by 8.16% on average over the past years. This is quite good.
Our Decent Value screener lists more Decent Value stocks and is updated daily.
For an up to date full fundamental analysis you can check the fundamental report of FOX
Keep in mind
Important Note: The content of this article is not intended as trading advice. It is essential to perform your own analysis and exercise caution when making trading decisions. The article presents observations created by automated analysis but does not guarantee any trading or investment outcomes. Always trade responsibly and make independent judgments.