
FOX CORP - CLASS B (NASDAQ:FOX) was identified as a decent value stock by our stock screener. FOX scores well on profitability, solvency and liquidity. At the same time it seems to be priced very reasonably. We'll explore this a bit deeper below.
How do we evaluate the Valuation for FOX?
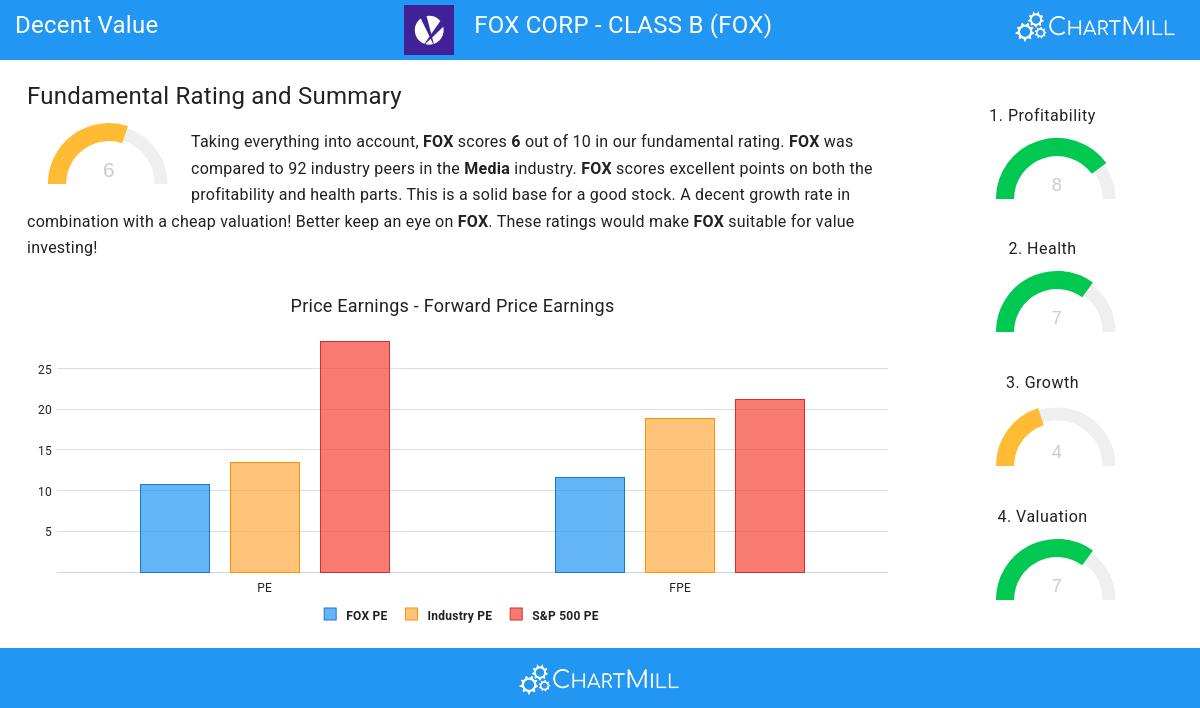
To assess a stock's valuation, ChartMill utilizes a Valuation Rating on a scale of 0 to 10. This comprehensive assessment considers various valuation aspects, comparing price to earnings and cash flows, while factoring in profitability and growth. FOX has achieved a 7 out of 10:
- With a Price/Earnings ratio of 10.71, the valuation of FOX can be described as very reasonable.
- Based on the Price/Earnings ratio, FOX is valued a bit cheaper than 72.83% of the companies in the same industry.
- When comparing the Price/Earnings ratio of FOX to the average of the S&P500 Index (28.38), we can say FOX is valued rather cheaply.
- FOX is valuated reasonably with a Price/Forward Earnings ratio of 11.57.
- Based on the Price/Forward Earnings ratio, FOX is valued a bit cheaper than the industry average as 77.17% of the companies are valued more expensively.
- When comparing the Price/Forward Earnings ratio of FOX to the average of the S&P500 Index (21.15), we can say FOX is valued slightly cheaper.
- 64.13% of the companies in the same industry are more expensive than FOX, based on the Enterprise Value to EBITDA ratio.
- Based on the Price/Free Cash Flow ratio, FOX is valued a bit cheaper than 70.65% of the companies in the same industry.
- The low PEG Ratio(NY), which compensates the Price/Earnings for growth, indicates a rather cheap valuation of the company.
- FOX has an outstanding profitability rating, which may justify a higher PE ratio.
Analyzing Profitability Metrics
ChartMill's Profitability Rating offers a unique perspective on stock analysis, providing scores from 0 to 10. These ratings consider a wide range of profitability metrics and margins, both in comparison to industry peers and on their own merits. For FOX, the assigned 8 is a significant indicator of profitability:
- The Return On Assets of FOX (9.49%) is better than 91.30% of its industry peers.
- With an excellent Return On Equity value of 19.01%, FOX belongs to the best of the industry, outperforming 89.13% of the companies in the same industry.
- FOX has a better Return On Invested Capital (11.45%) than 92.39% of its industry peers.
- FOX had an Average Return On Invested Capital over the past 3 years of 10.04%. This is above the industry average of 6.86%.
- The last Return On Invested Capital (11.45%) for FOX is above the 3 year average (10.04%), which is a sign of increasing profitability.
- With an excellent Profit Margin value of 14.39%, FOX belongs to the best of the industry, outperforming 90.22% of the companies in the same industry.
- FOX's Operating Margin of 20.37% is amongst the best of the industry. FOX outperforms 90.22% of its industry peers.
What does the Health looks like for FOX
ChartMill employs its own Health Rating for stock assessment. This rating, ranging from 0 to 10, is calculated by examining various liquidity and solvency ratios. In the case of FOX, the assigned 7 reflects its health status:
- FOX's Altman-Z score of 2.71 is amongst the best of the industry. FOX outperforms 82.61% of its industry peers.
- The Debt to FCF ratio of FOX is 3.92, which is a good value as it means it would take FOX, 3.92 years of fcf income to pay off all of its debts.
- With a decent Debt to FCF ratio value of 3.92, FOX is doing good in the industry, outperforming 79.35% of the companies in the same industry.
- A Current Ratio of 2.50 indicates that FOX has no problem at all paying its short term obligations.
- Looking at the Current ratio, with a value of 2.50, FOX is in the better half of the industry, outperforming 76.09% of the companies in the same industry.
- FOX has a Quick Ratio of 2.14. This indicates that FOX is financially healthy and has no problem in meeting its short term obligations.
- Looking at the Quick ratio, with a value of 2.14, FOX is in the better half of the industry, outperforming 69.57% of the companies in the same industry.
A Closer Look at Growth for FOX
Every stock receives a Growth Rating from ChartMill, ranging from 0 to 10. This rating assesses various growth aspects, including historical and projected EPS and revenue growth. FOX boasts a 4 out of 10:
- FOX shows a strong growth in Earnings Per Share. In the last year, the EPS has been growing by 35.38%, which is quite impressive.
- The Earnings Per Share has been growing by 8.16% on average over the past years. This is quite good.
Every day, new Decent Value stocks can be found on ChartMill in our Decent Value screener.
Our latest full fundamental report of FOX contains the most current fundamental analsysis.
Disclaimer
This is not investing advice! The article highlights some of the observations at the time of writing, but you should always make your own analysis and invest based on your own insights.