
Investors looking to find high-potential stocks frequently use systematic methods that mix strict technical study with basic growth measures. One method is supported by well-known trader Mark Minervini, whose plan centers on finding market leaders early in their main price increases. The center of this method is the "Trend Template," a group of technical rules made to confirm a stock is in a strong, confirmed uptrend. This is paired with a detailed look into the company's basic financial condition, specifically searching for quickening earnings and sales growth, the signs of what Minervini calls "super-performance." A stock that meets both the strict technical list and shows solid basic momentum offers a strong case for investors focused on high growth.
Fabrinet (NYSE:FN) offers optical packaging and electronic manufacturing services and has recently appeared on filters that combine Minervini's ideas with a focus on high-growth momentum. We will look at how FN fits with this two-part investment view.
Fit with the Minervini Trend Template
Minervini's Trend Template is created to remove weak stocks and find those with the greatest chance of continuing a solid uptrend. It is a basic step in his Specific Entry Point Analysis (SEPA) system, making sure an investor only looks at stocks in a favorable position. A study of FN's chart indicates it hits the important technical marks:
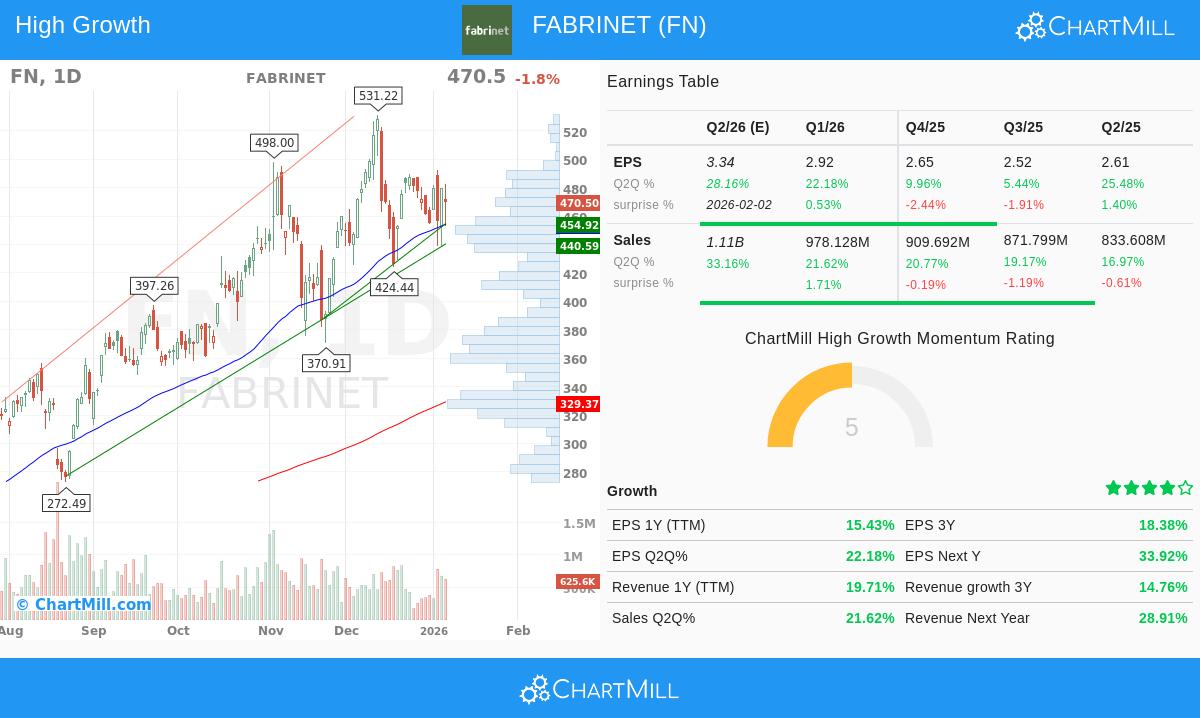
- Price Above Key Moving Averages: FN's present price trades well above its rising 50-day ($454.27), 150-day ($369.96), and 200-day ($329.37) simple moving averages. This layered order is a clear indicator of a sound Stage 2 advance.
- Moving Average Order: The 50-day SMA is above both the 150-day and 200-day SMAs, and the 150-day SMA is above the 200-day SMA. This sequence verifies solid bullish momentum across several time periods.
- Nearness to Highs: The stock is trading within 11% of its 52-week high of $531.22, a main Minervini rule that stresses concentrating on strength, not weakness. Leaders often reach new highs.
- Solid Relative Strength: With a relative strength ranking of 94.83, FN is doing better than almost 95% of all stocks in the market. High relative strength is essential in the Minervini plan, as it finds sector and market leaders.
This technical view proposes FN is in a verified long-term uptrend, meeting the "trend" part needed for any Minervini-style setup.
Basics: The Driver for High Growth Momentum
While the Trend Template finds the "how" of a stock's price movement, Minervini highlights that the "why" is located in the basics. Major stock performance is nearly always preceded by, or happens at the same time as, better business performance. This is where the High Growth Momentum (HGM) score is useful, as it searches for companies displaying quickening financial growth. FN's recent financial numbers show a solid basic condition:
- Earnings Quickening: The company has shown a trend of quickening earnings growth on a quarterly year-over-year basis, with the latest quarter showing a rise of over 22%. This quickening is an important sign that business momentum is increasing.
- Solid Sales Growth: Revenue growth stays solid, with the last quarter up over 21% year-over-year. Analysts are also positive on the future, having increased their revenue estimates for the next year by nearly 9.5% over the past three months.
- Positive Estimate Changes: The average earnings estimate for the next fiscal year has been adjusted upward by more than 8.6% in the last three months. Minervini gives great weight to upward changes, as they often come before institutional buying and more price gains.
- Steady Profitability: The company keeps sound and stable profit margins in the ~9-10% range, showing that its growth is not happening with a loss of profitability.
These points add to a profile of a company that is not only growing, but whose growth path is making an impression on analysts and, probably, the market. This basic strength gives the possible "catalyst" that can push a technically sound stock to higher levels.
Technical Condition and Present Pattern
According to ChartMill's own analysis, Fabrinet has a very good Technical Rating of 9 out of 10, verifying the solid uptrend seen in the Trend Template study. The long-term trend is scored as positive, and the stock does better than 94% of the market and 89% of its industry group. The report mentions several support levels below the present price, with the closest important area between $454 and $455, which matches closely with the rising 50-day moving average.
However, the analysis also mentions that the short-term trend is currently neutral and the Setup Quality rating is a moderate 4. This shows that while the stock's long-term condition is very good, it is not in a precise, instant breakout pattern at this exact moment. For a Minervini-style trader, this would mean FN is a solid candidate for a watchlist, waiting for a clearer volatility decrease pattern or a high-volume breakout from a new period of stability to mark a best entry point.
You can see the complete, detailed technical analysis for Fabrinet here: ChartMill Technical Report for FN.
Summary
Fabrinet offers a strong case for investors using a high-growth momentum plan guided by Minervini's ideas. The stock meets the strict technical filters of the Trend Template, confirming its place in a solid market-leading uptrend. Basically, it shows the kind of quickening earnings and sales growth, along with positive analyst changes, that usually supports continued super-performance. While the present chart displays stability instead of an instant breakout pattern, the core technical and basic fit makes FN a leading candidate for careful watching. Investors using this method would look for the formation of a low-volume stability period followed by a high-volume turning point to start a position, always using clear risk management rules.
Want to find more stocks that match this high-growth, trend-following profile? You can use the same "High Growth Momentum + Trend Template" filter that found Fabrinet to find other possible candidates. See the filter here: High Growth Momentum + Trend Template Screen.
,
Disclaimer: This article is for informational and educational purposes only. It is not a recommendation to buy or sell any security. All investing and trading involves risk, and readers should conduct their own research and consult with a qualified financial advisor before making any investment decisions.