
Take a closer look at FABRINET (NYSE:FN), an affordable growth stock uncovered by our stock screener. FN boasts strong growth prospects and excels in financial health indicators, all while maintaining a reasonable valuation. Let's break it down further.
Understanding FN's Growth
ChartMill assigns a proprietary Growth Rating to each stock. The score is computed by evaluating various growth aspects, like EPS and revenue growth. We take into account the history as well as the estimated future numbers. FN was assigned a score of 7 for growth:
- The Earnings Per Share has grown by an impressive 24.37% over the past year.
- Measured over the past years, FN shows a quite strong growth in Earnings Per Share. The EPS has been growing by 18.44% on average per year.
- FN shows quite a strong growth in Revenue. In the last year, the Revenue has grown by 14.83%.
- Measured over the past years, FN shows a quite strong growth in Revenue. The Revenue has been growing by 12.72% on average per year.
- The Earnings Per Share is expected to grow by 17.01% on average over the next years. This is quite good.
- Based on estimates for the next years, FN will show a quite strong growth in Revenue. The Revenue will grow by 15.63% on average per year.
- The Revenue growth rate is accelerating: in the next years the growth will be better than in the last years.
Analyzing Valuation Metrics
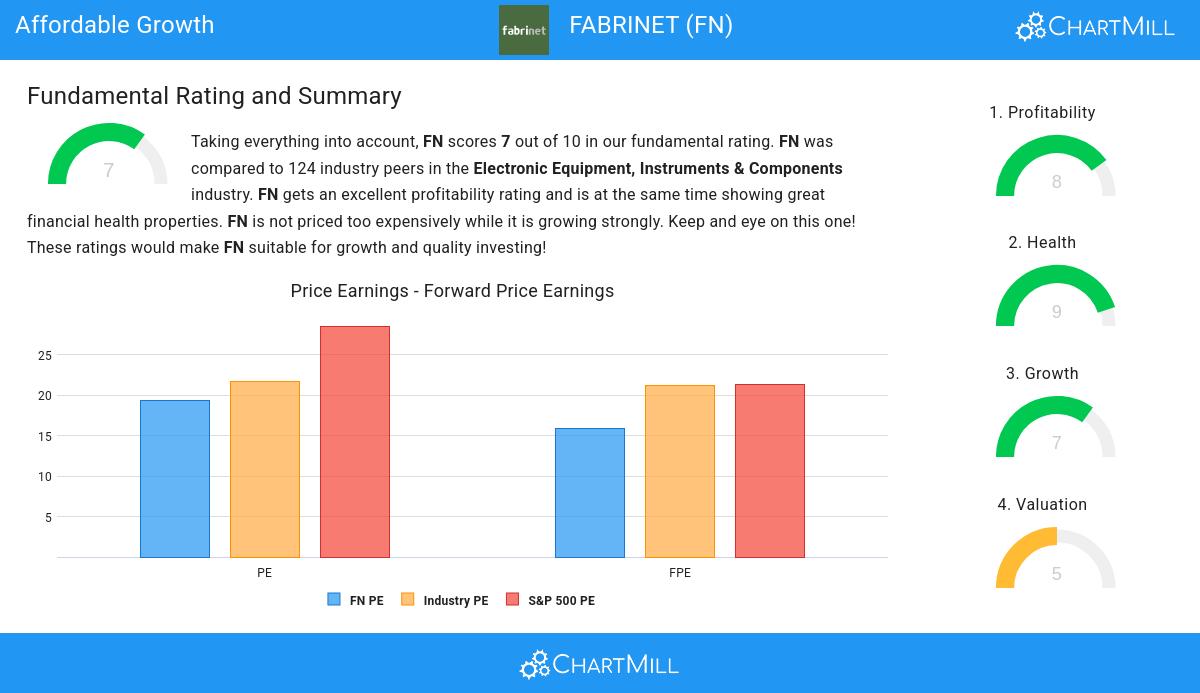
ChartMill employs its own Valuation Rating system for all stocks. This score, ranging from 0 to 10, is determined by evaluating different valuation factors, including price to earnings and free cash flow, both in absolute terms and relative to the market and industry. FN has earned a 5 for valuation:
- 69.35% of the companies in the same industry are more expensive than FN, based on the Price/Earnings ratio.
- The average S&P500 Price/Earnings ratio is at 28.55. FN is valued slightly cheaper when compared to this.
- Based on the Price/Forward Earnings ratio, FN is valued a bit cheaper than 71.77% of the companies in the same industry.
- FN's Price/Forward Earnings ratio indicates a valuation a bit cheaper than the S&P500 average which is at 21.37.
- 70.97% of the companies in the same industry are more expensive than FN, based on the Price/Free Cash Flow ratio.
- The excellent profitability rating of FN may justify a higher PE ratio.
- FN's earnings are expected to grow with 17.01% in the coming years. This may justify a more expensive valuation.
A Closer Look at Health for FN
ChartMill assigns a Health Rating to every stock. This score ranges from 0 to 10 and evaluates the different health aspects like liquidity and solvency, both absolutely, but also relative to the industry peers. FN scores a 9 out of 10:
- An Altman-Z score of 9.25 indicates that FN is not in any danger for bankruptcy at the moment.
- FN has a better Altman-Z score (9.25) than 90.32% of its industry peers.
- FN has no outstanding debt. Therefor its Debt/Equity and Debt/FCF ratios are 0 and belong to the best of the industry.
- FN has a Current Ratio of 3.32. This indicates that FN is financially healthy and has no problem in meeting its short term obligations.
- FN has a Current ratio of 3.32. This is in the better half of the industry: FN outperforms 69.35% of its industry peers.
- FN has a Quick Ratio of 2.58. This indicates that FN is financially healthy and has no problem in meeting its short term obligations.
- FN has a Quick ratio of 2.58. This is in the better half of the industry: FN outperforms 67.74% of its industry peers.
Profitability Assessment of FN
ChartMill employs its own Profitability Rating system for stock evaluation. This score, ranging from 0 to 10, is derived from an analysis of diverse profitability metrics and margins. In the case of FN, the assigned 8 is noteworthy for profitability:
- The Return On Assets of FN (12.82%) is better than 92.74% of its industry peers.
- FN has a better Return On Equity (17.69%) than 87.90% of its industry peers.
- FN has a better Return On Invested Capital (12.67%) than 87.90% of its industry peers.
- FN had an Average Return On Invested Capital over the past 3 years of 12.81%. This is above the industry average of 9.25%.
- The Profit Margin of FN (10.44%) is better than 83.87% of its industry peers.
- FN's Profit Margin has improved in the last couple of years.
- The Operating Margin of FN (9.65%) is better than 80.65% of its industry peers.
- FN's Operating Margin has improved in the last couple of years.
- FN's Gross Margin has improved in the last couple of years.
Our Affordable Growth screener lists more Affordable Growth stocks and is updated daily.
Our latest full fundamental report of FN contains the most current fundamental analsysis.
Keep in mind
Important Note: The content of this article is not intended as trading advice. It is essential to perform your own analysis and exercise caution when making trading decisions. The article presents observations created by automated analysis but does not guarantee any trading or investment outcomes. Always trade responsibly and make independent judgments.