
Flutter Entertainment PLC-DI (NYSE:FLUT) has become a strong choice in a recent search for technical breakout patterns. The screening process uses two custom indicators from ChartMill: the Technical Rating, which assesses the overall condition of a stock’s trend, and the Setup Quality Rating, which spots consolidation patterns that often lead to breakouts. Stocks scoring well on both metrics, usually 7 or higher, are seen as top picks for technical traders. FLUT not only meets but surpasses these standards, with a top Technical Rating of 10 and an equally high Setup Rating of 10.
Technical Strength: A Leading Stock in an Uptrend
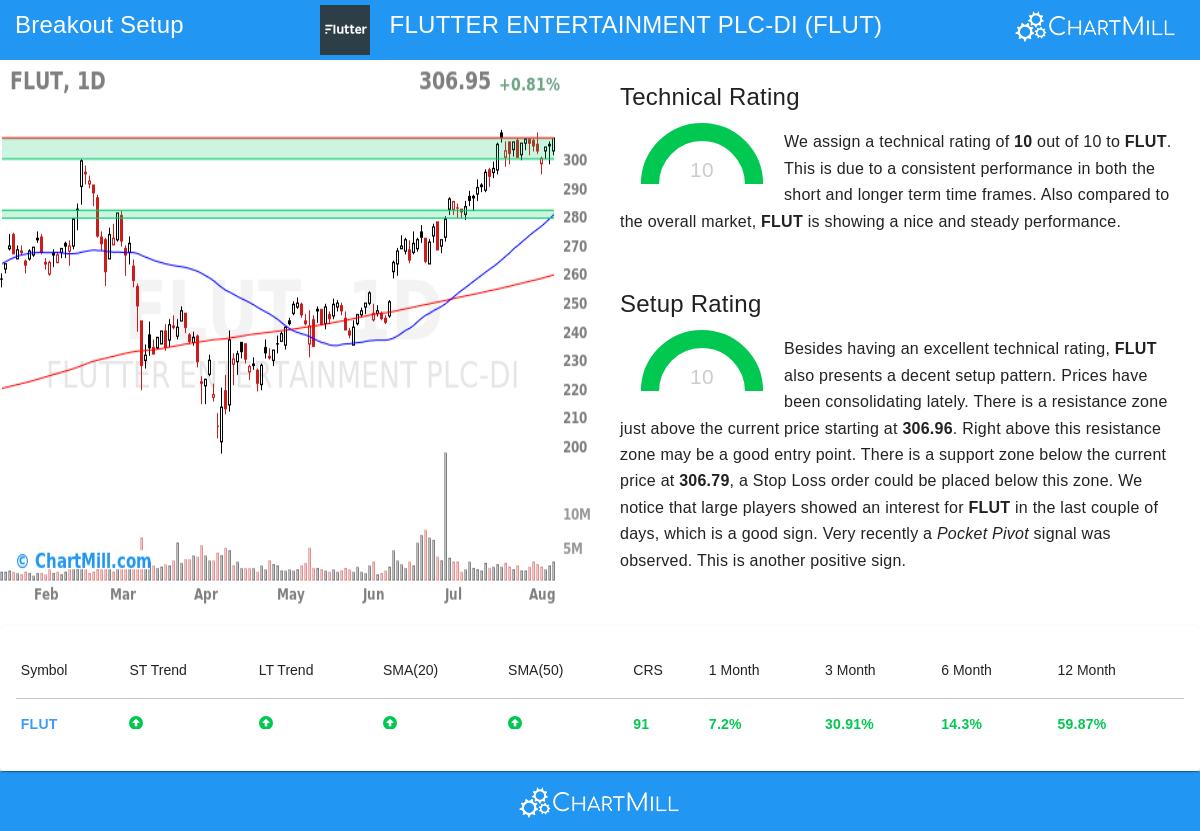
FLUT’s Technical Rating of 10 puts it in the top tier of stocks from a trend standpoint. Key reasons for this score include:
- Solid Trend Direction: Both short-term and long-term trends are upward, supporting the stock’s positive movement.
- Relative Performance: FLUT has done better than 91% of all stocks over the past year, showing steady price growth.
- Sector Position: In the Hotels, Restaurants & Leisure industry, FLUT is in the top 14%, beating 86% of its competitors.
- Moving Averages: The stock is above all major moving averages (20-day, 50-day, 100-day, and 200-day), with each average moving upward, a clear sign of continued bullish momentum.
The stock is also close to its 52-week high, which, along with its strong relative performance, indicates it is a leader rather than just following broader market trends. For more details on the technicals, the full technical report offers further analysis.
Setup Quality: A Consolidation Ready for a Breakout
While the high Technical Rating confirms FLUT’s upward trend, the Setup Rating of 10 points to a good entry opportunity. Key features of the setup include:
- Narrow Consolidation: Over the past month, FLUT has moved between $285.01 and $309.77, with recent prices near the top of this range. This tight trading often comes before a breakout.
- Support and Resistance Levels: A clear resistance area is just above the current price at $306.96, while support is around $299.61 to $306.79. A move above resistance could signal further gains.
- Institutional Activity: Large investors have shown more buying interest, and a recent "Pocket Pivot"—a bullish price and volume pattern—adds more confirmation.
The mix of a strong trend and a clear setup makes it easier for traders, offering defined levels for entry and stop-loss placement.
Trade Ideas
For those looking at a breakout strategy, the following steps could apply:
- Entry: A buy-stop order above $306.97 (just above resistance) to confirm breakout momentum.
- Stop-Loss: Set below $299.60 (near the support zone), limiting potential losses to around 2.4%.
- Portfolio Allocation: Depending on risk tolerance, allocating up to 25% of capital could make sense given the favorable risk/reward ratio.
Note that the current setup is more short-term; traders with longer-term goals might use wider stops to handle volatility.
Find More Breakout Opportunities
FLUT is one of several high-quality breakout patterns found by this screening method. For traders interested in other options, the Technical Breakout Setups screener updates daily with new ideas.
Disclaimer: This analysis is for informational purposes only and should not be seen as investment advice. Always do your own research and consider risk management before trading.