
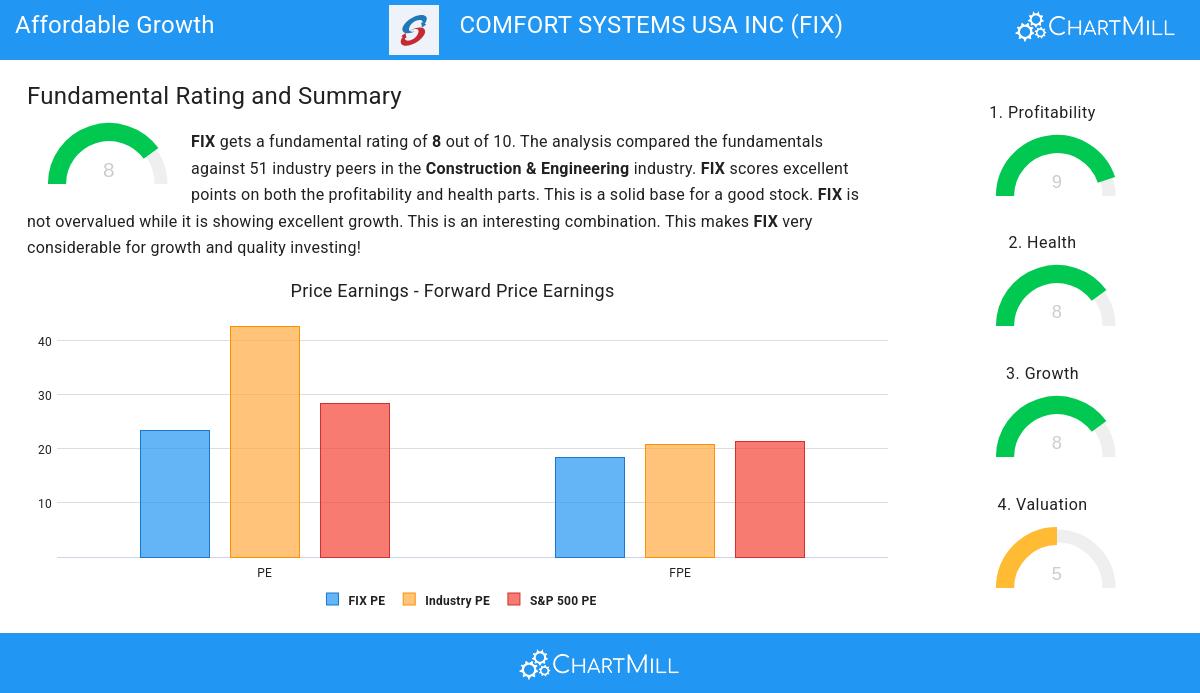
Uncover the potential of COMFORT SYSTEMS USA INC (NYSE:FIX), a growth stock that our stock screener found to be reasonably priced. FIX is excelling in growth aspects, maintaining a healthy financial position, and still offers an attractive valuation. We'll examine each aspect in detail.
Growth Examination for FIX
ChartMill assigns a Growth Rating to every stock. This score ranges from 0 to 10 and evaluates the different growth aspects like EPS and Revenue, both in the past as in the future. FIX scores a 8 out of 10:
- FIX shows a strong growth in Earnings Per Share. In the last year, the EPS has been growing by 67.35%, which is quite impressive.
- FIX shows a strong growth in Earnings Per Share. Measured over the last years, the EPS has been growing by 36.79% yearly.
- Looking at the last year, FIX shows a very strong growth in Revenue. The Revenue has grown by 34.97%.
- FIX shows a strong growth in Revenue. Measured over the last years, the Revenue has been growing by 21.86% yearly.
- Based on estimates for the next years, FIX will show a quite strong growth in Earnings Per Share. The EPS will grow by 15.03% on average per year.
- FIX is expected to show quite a strong growth in Revenue. In the coming years, the Revenue will grow by 8.89% yearly.
Deciphering FIX's Valuation Rating
ChartMill assigns a Valuation Rating to each stock, ranging from 0 to 10. This rating is calculated by analyzing different valuation elements, such as price to earnings and free cash flow, both in absolute terms and relative to the market and industry. In the case of FIX, the assigned 5 reflects its valuation:
- FIX's Price/Earnings ratio is a bit cheaper when compared to the industry. FIX is cheaper than 60.78% of the companies in the same industry.
- Based on the Price/Forward Earnings ratio, FIX is valued a bit cheaper than the industry average as 60.78% of the companies are valued more expensively.
- Based on the Price/Free Cash Flow ratio, FIX is valued a bit cheaper than 70.59% of the companies in the same industry.
- The low PEG Ratio(NY), which compensates the Price/Earnings for growth, indicates a rather cheap valuation of the company.
- FIX has an outstanding profitability rating, which may justify a higher PE ratio.
- FIX's earnings are expected to grow with 15.03% in the coming years. This may justify a more expensive valuation.
Evaluating Health: FIX
To gauge a stock's financial health, ChartMill utilizes a Health Rating on a scale of 0 to 10. This comprehensive evaluation encompasses liquidity and solvency, both in absolute terms and in comparison to industry peers. FIX has earned a 8 out of 10:
- An Altman-Z score of 4.95 indicates that FIX is not in any danger for bankruptcy at the moment.
- With an excellent Altman-Z score value of 4.95, FIX belongs to the best of the industry, outperforming 84.31% of the companies in the same industry.
- FIX has a debt to FCF ratio of 0.09. This is a very positive value and a sign of high solvency as it would only need 0.09 years to pay back of all of its debts.
- With an excellent Debt to FCF ratio value of 0.09, FIX belongs to the best of the industry, outperforming 92.16% of the companies in the same industry.
- FIX has a Debt/Equity ratio of 0.04. This is a healthy value indicating a solid balance between debt and equity.
- FIX has a Debt to Equity ratio of 0.04. This is amongst the best in the industry. FIX outperforms 86.27% of its industry peers.
- The current and quick ratio evaluation for FIX is rather negative, while it does have excellent solvency and profitability. These ratios do not necessarly indicate liquidity issues and need to be evaluated against the specifics of the business.
What does the Profitability looks like for FIX
ChartMill assigns a proprietary Profitability Rating to each stock. The score is computed by evaluating various profitability ratios and margins and ranges from 0 to 10. FIX was assigned a score of 9 for profitability:
- FIX has a Return On Assets of 11.09%. This is amongst the best in the industry. FIX outperforms 84.31% of its industry peers.
- FIX has a better Return On Equity (30.65%) than 84.31% of its industry peers.
- FIX's Return On Invested Capital of 28.35% is amongst the best of the industry. FIX outperforms 96.08% of its industry peers.
- Measured over the past 3 years, the Average Return On Invested Capital for FIX is significantly above the industry average of 12.16%.
- The 3 year average ROIC (21.29%) for FIX is below the current ROIC(28.35%), indicating increased profibility in the last year.
- Looking at the Profit Margin, with a value of 7.43%, FIX belongs to the top of the industry, outperforming 80.39% of the companies in the same industry.
- FIX's Profit Margin has improved in the last couple of years.
- The Operating Margin of FIX (10.62%) is better than 86.27% of its industry peers.
- In the last couple of years the Operating Margin of FIX has grown nicely.
- FIX has a Gross Margin of 21.01%. This is in the better half of the industry: FIX outperforms 68.63% of its industry peers.
- In the last couple of years the Gross Margin of FIX has grown nicely.
More Affordable Growth stocks can be found in our Affordable Growth screener.
For an up to date full fundamental analysis you can check the fundamental report of FIX
Disclaimer
This is not investing advice! The article highlights some of the observations at the time of writing, but you should always make your own analysis and invest based on your own insights.