
Groth investors are looking for stocks showing high revenue and EPS growth. We will have a look here to see if COMFORT SYSTEMS USA INC (NYSE:FIX) is suited for growth investing, while it is forming a base and may be ready to breakout. Investors should of course do their own research, but we spotted COMFORT SYSTEMS USA INC showing up in our growth with base formation screen, so it may be worth spending some more time on it.
Unpacking FIX's Growth Rating
Every stock receives a Growth Rating from ChartMill, ranging from 0 to 10. This rating assesses various growth aspects, including historical and projected EPS and revenue growth. FIX boasts a 8 out of 10:
- FIX shows a strong growth in Earnings Per Share. In the last year, the EPS has been growing by 67.35%, which is quite impressive.
- Measured over the past years, FIX shows a very strong growth in Earnings Per Share. The EPS has been growing by 36.79% on average per year.
- The Revenue has grown by 34.97% in the past year. This is a very strong growth!
- The Revenue has been growing by 21.86% on average over the past years. This is a very strong growth!
- The Earnings Per Share is expected to grow by 15.03% on average over the next years. This is quite good.
- Based on estimates for the next years, FIX will show a quite strong growth in Revenue. The Revenue will grow by 8.89% on average per year.
What does the Health looks like for FIX
ChartMill utilizes a Health Rating to assess stocks, scoring them on a scale of 0 to 10. This rating takes into account a variety of liquidity and solvency ratios, both in absolute terms and in comparison to industry peers. FIX has earned a 8 out of 10:
- An Altman-Z score of 5.00 indicates that FIX is not in any danger for bankruptcy at the moment.
- The Altman-Z score of FIX (5.00) is better than 84.31% of its industry peers.
- The Debt to FCF ratio of FIX is 0.09, which is an excellent value as it means it would take FIX, only 0.09 years of fcf income to pay off all of its debts.
- FIX has a better Debt to FCF ratio (0.09) than 92.16% of its industry peers.
- A Debt/Equity ratio of 0.04 indicates that FIX is not too dependend on debt financing.
- FIX has a better Debt to Equity ratio (0.04) than 86.27% of its industry peers.
- The current and quick ratio evaluation for FIX is rather negative, while it does have excellent solvency and profitability. These ratios do not necessarly indicate liquidity issues and need to be evaluated against the specifics of the business.
Analyzing Profitability Metrics
ChartMill's Profitability Rating offers a unique perspective on stock analysis, providing scores from 0 to 10. These ratings consider a wide range of profitability metrics and margins, both in comparison to industry peers and on their own merits. For FIX, the assigned 9 is a significant indicator of profitability:
- Looking at the Return On Assets, with a value of 11.09%, FIX belongs to the top of the industry, outperforming 84.31% of the companies in the same industry.
- The Return On Equity of FIX (30.65%) is better than 84.31% of its industry peers.
- FIX has a better Return On Invested Capital (28.35%) than 96.08% of its industry peers.
- Measured over the past 3 years, the Average Return On Invested Capital for FIX is significantly above the industry average of 12.16%.
- The last Return On Invested Capital (28.35%) for FIX is above the 3 year average (21.29%), which is a sign of increasing profitability.
- With an excellent Profit Margin value of 7.43%, FIX belongs to the best of the industry, outperforming 80.39% of the companies in the same industry.
- FIX's Profit Margin has improved in the last couple of years.
- FIX has a better Operating Margin (10.62%) than 86.27% of its industry peers.
- FIX's Operating Margin has improved in the last couple of years.
- FIX has a better Gross Margin (21.01%) than 68.63% of its industry peers.
- FIX's Gross Margin has improved in the last couple of years.
Why is FIX a setup?
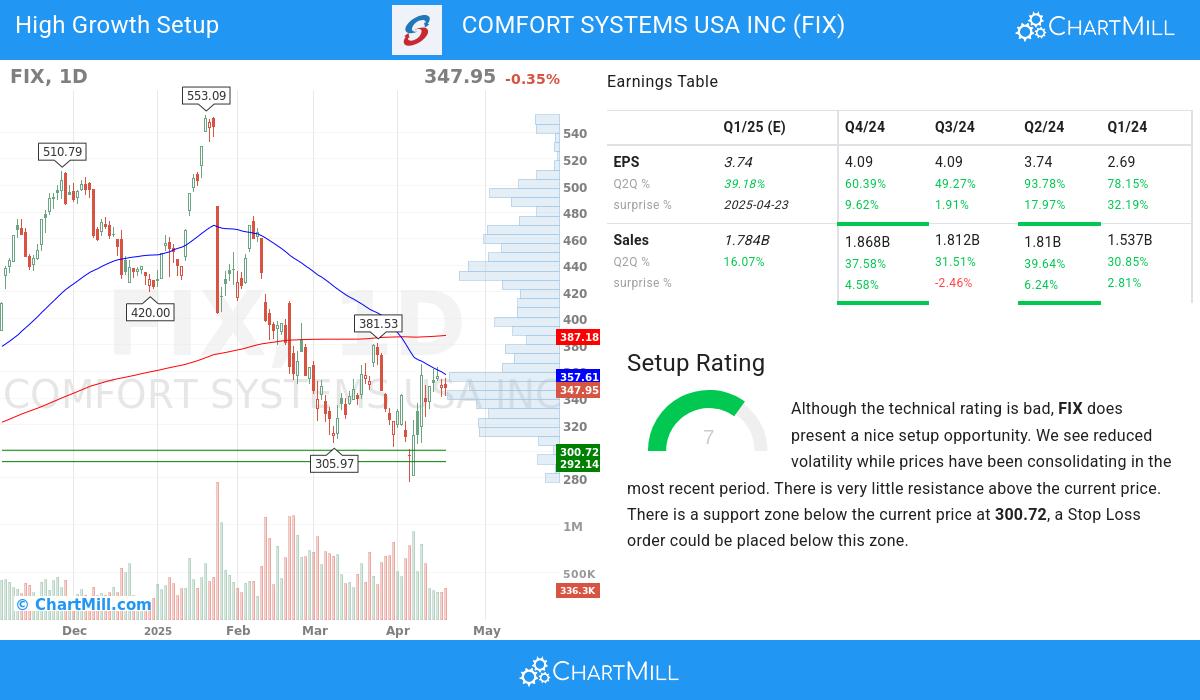
The Setup Rating of a stock determines to which extend the stock is consolidating. This score also ranges from 0 to 10 and is updated daily. The setup score evaluates various short term technical indicators. For FIX this score is currently 7:
FIX has a bad technical rating, but it does show a decent setup pattern. We see reduced volatility while prices have been consolidating in the most recent period. There is very little resistance above the current price. There is a support zone below the current price at 300.72, a Stop Loss order could be placed below this zone.
More Strong Growth stocks can be found in our Strong Growth screener.
For an up to date full fundamental analysis you can check the fundamental report of FIX
For an up to date full technical analysis you can check the technical report of FIX
Disclaimer
This is not investing advice! The article highlights some of the observations at the time of writing, but you should always make your own analysis and invest based on your own insights.