
COMFORT SYSTEMS USA INC (NYSE:FIX) has caught the eye of our stock screener as an affordable growth stock. FIX is displaying robust growth metrics and also excels in terms of profitability, solvency, and liquidity. Additionally, it appears to be reasonably priced. Let's delve into the details.
Deciphering FIX's Growth Rating
ChartMill assigns a Growth Rating to each stock, ranging from 0 to 10. This rating is determined by analyzing different growth elements, including EPS and revenue growth, spanning both historical and future figures. In the case of FIX, the assigned 8 reflects its growth potential:
- The Earnings Per Share has grown by an impressive 67.35% over the past year.
- The Earnings Per Share has been growing by 36.79% on average over the past years. This is a very strong growth
- The Revenue has grown by 34.97% in the past year. This is a very strong growth!
- The Revenue has been growing by 21.86% on average over the past years. This is a very strong growth!
- FIX is expected to show quite a strong growth in Earnings Per Share. In the coming years, the EPS will grow by 15.03% yearly.
- FIX is expected to show quite a strong growth in Revenue. In the coming years, the Revenue will grow by 8.89% yearly.
Valuation Assessment of FIX
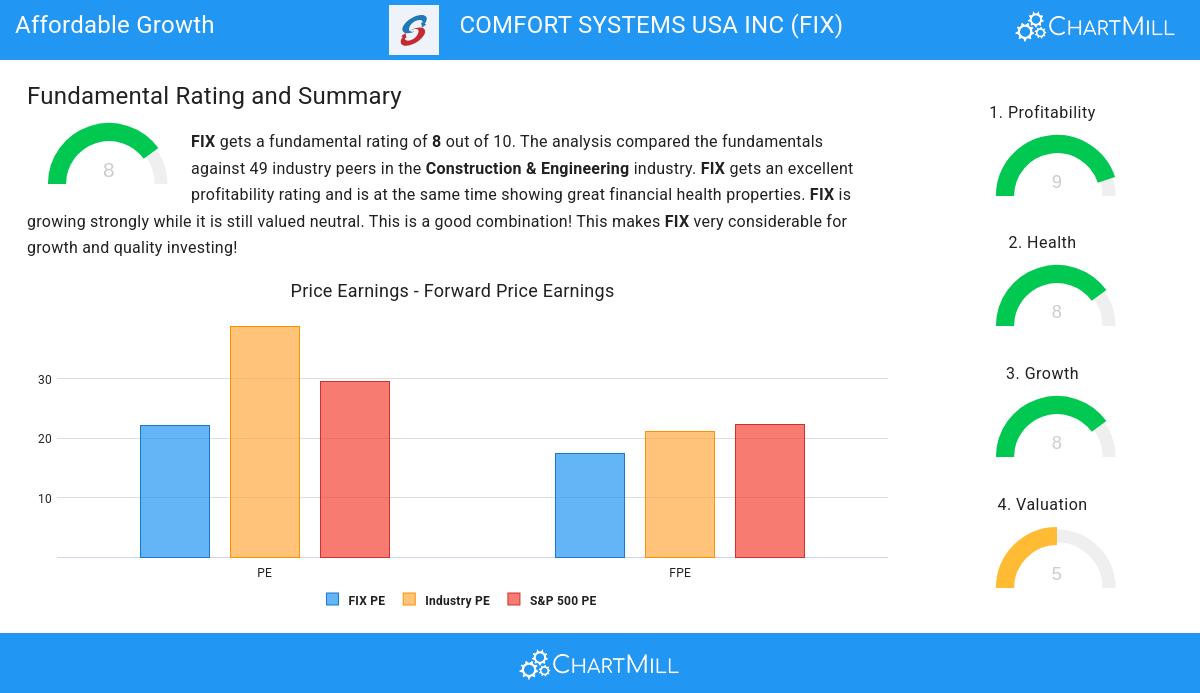
ChartMill assigns a proprietary Valuation Rating to each stock. The score is computed by evaluating various valuation aspects, like price to earnings and free cash flow, both absolutely as relative to the market and industry. FIX was assigned a score of 5 for valuation:
- The average S&P500 Price/Earnings ratio is at 29.51. FIX is valued slightly cheaper when compared to this.
- Based on the Price/Forward Earnings ratio, FIX is valued a bit cheaper than 61.22% of the companies in the same industry.
- When comparing the Price/Forward Earnings ratio of FIX to the average of the S&P500 Index (22.30), we can say FIX is valued slightly cheaper.
- 61.22% of the companies in the same industry are more expensive than FIX, based on the Enterprise Value to EBITDA ratio.
- Based on the Price/Free Cash Flow ratio, FIX is valued a bit cheaper than 69.39% of the companies in the same industry.
- FIX's low PEG Ratio(NY), which compensates the Price/Earnings for growth, indicates a rather cheap valuation of the company.
- FIX has an outstanding profitability rating, which may justify a higher PE ratio.
- FIX's earnings are expected to grow with 15.03% in the coming years. This may justify a more expensive valuation.
Health Assessment of FIX
ChartMill assigns a proprietary Health Rating to each stock. The score is computed by evaluating various liquidity and solvency ratios and ranges from 0 to 10. FIX was assigned a score of 8 for health:
- An Altman-Z score of 4.84 indicates that FIX is not in any danger for bankruptcy at the moment.
- The Altman-Z score of FIX (4.84) is better than 85.71% of its industry peers.
- The Debt to FCF ratio of FIX is 0.09, which is an excellent value as it means it would take FIX, only 0.09 years of fcf income to pay off all of its debts.
- Looking at the Debt to FCF ratio, with a value of 0.09, FIX belongs to the top of the industry, outperforming 91.84% of the companies in the same industry.
- A Debt/Equity ratio of 0.04 indicates that FIX is not too dependend on debt financing.
- FIX has a better Debt to Equity ratio (0.04) than 87.76% of its industry peers.
- FIX does not score too well on the current and quick ratio evaluation. However, as it has excellent solvency and profitability, these ratios do not necessarly indicate liquidity issues and need to be evaluated against the specifics of the business.
Exploring FIX's Profitability
Discover ChartMill's exclusive Profitability Rating, a proprietary metric that assesses stocks on a scale of 0 to 10. It takes into consideration various profitability ratios and margins, both in absolute terms and relative to industry peers. Notably, FIX has achieved a 9:
- FIX's Return On Assets of 11.09% is amongst the best of the industry. FIX outperforms 83.67% of its industry peers.
- The Return On Equity of FIX (30.65%) is better than 83.67% of its industry peers.
- The Return On Invested Capital of FIX (28.35%) is better than 95.92% of its industry peers.
- The Average Return On Invested Capital over the past 3 years for FIX is significantly above the industry average of 11.99%.
- The 3 year average ROIC (21.29%) for FIX is below the current ROIC(28.35%), indicating increased profibility in the last year.
- FIX's Profit Margin of 7.43% is amongst the best of the industry. FIX outperforms 81.63% of its industry peers.
- In the last couple of years the Profit Margin of FIX has grown nicely.
- Looking at the Operating Margin, with a value of 10.62%, FIX belongs to the top of the industry, outperforming 87.76% of the companies in the same industry.
- In the last couple of years the Operating Margin of FIX has grown nicely.
- FIX has a Gross Margin of 21.01%. This is in the better half of the industry: FIX outperforms 69.39% of its industry peers.
- FIX's Gross Margin has improved in the last couple of years.
Our Affordable Growth screener lists more Affordable Growth stocks and is updated daily.
Check the latest full fundamental report of FIX for a complete fundamental analysis.
Disclaimer
Important Note: The content of this article is not intended as trading advice. It is essential to perform your own analysis and exercise caution when making trading decisions. The article presents observations created by automated analysis but does not guarantee any trading or investment outcomes. Always trade responsibly and make independent judgments.