
Our stock screening tool has pinpointed FEDERATED HERMES INC (NYSE:FHI) as an undervalued stock option. NYSE:FHI retains a strong financial foundation and an attractive price tag. Let's delve into the specifics below.
Looking at the Valuation
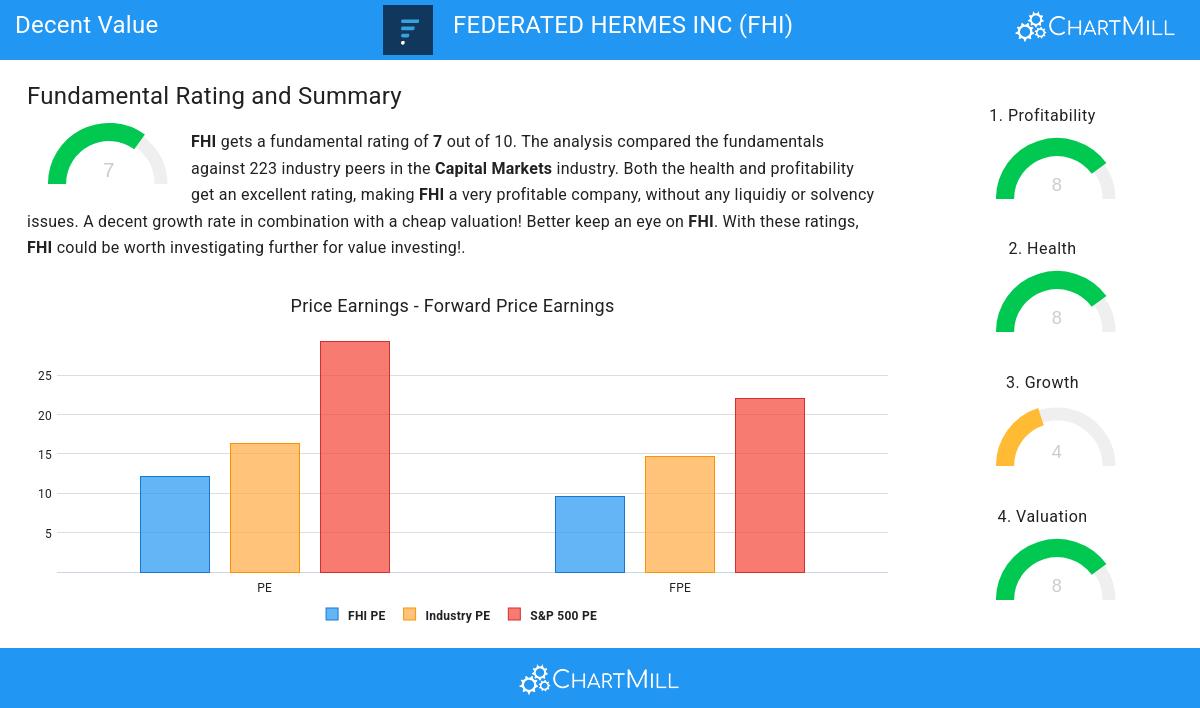
ChartMill assigns a Valuation Rating to every stock. This score ranges from 0 to 10 and evaluates the different valuation aspects and compares the price to earnings and cash flows, while taking into account profitability and growth. NYSE:FHI scores a 8 out of 10:
- Compared to the rest of the industry, the Price/Earnings ratio of FHI indicates a somewhat cheap valuation: FHI is cheaper than 60.99% of the companies listed in the same industry.
- FHI's Price/Earnings ratio indicates a rather cheap valuation when compared to the S&P500 average which is at 29.35.
- The Price/Forward Earnings ratio is 9.59, which indicates a very decent valuation of FHI.
- Based on the Price/Forward Earnings ratio, FHI is valued a bit cheaper than 70.40% of the companies in the same industry.
- The average S&P500 Price/Forward Earnings ratio is at 22.10. FHI is valued rather cheaply when compared to this.
- 93.72% of the companies in the same industry are more expensive than FHI, based on the Enterprise Value to EBITDA ratio.
- Based on the Price/Free Cash Flow ratio, FHI is valued a bit cheaper than 75.78% of the companies in the same industry.
- The low PEG Ratio(NY), which compensates the Price/Earnings for growth, indicates a rather cheap valuation of the company.
- FHI has an outstanding profitability rating, which may justify a higher PE ratio.
- FHI's earnings are expected to grow with 12.36% in the coming years. This may justify a more expensive valuation.
Profitability Insights: NYSE:FHI
ChartMill assigns a proprietary Profitability Rating to each stock. The score is computed by evaluating various profitability ratios and margins and ranges from 0 to 10. NYSE:FHI was assigned a score of 8 for profitability:
- With an excellent Return On Assets value of 15.86%, FHI belongs to the best of the industry, outperforming 96.41% of the companies in the same industry.
- With an excellent Return On Equity value of 30.19%, FHI belongs to the best of the industry, outperforming 95.52% of the companies in the same industry.
- With an excellent Return On Invested Capital value of 21.30%, FHI belongs to the best of the industry, outperforming 98.21% of the companies in the same industry.
- FHI had an Average Return On Invested Capital over the past 3 years of 16.23%. This is significantly above the industry average of 7.05%.
- The 3 year average ROIC (16.23%) for FHI is below the current ROIC(21.30%), indicating increased profibility in the last year.
- The Gross Margin of FHI (95.24%) is better than 95.07% of its industry peers.
Understanding NYSE:FHI's Health
To gauge a stock's financial health, ChartMill utilizes a Health Rating on a scale of 0 to 10. This comprehensive evaluation encompasses liquidity and solvency, both in absolute terms and in comparison to industry peers. NYSE:FHI has earned a 8 out of 10:
- An Altman-Z score of 4.85 indicates that FHI is not in any danger for bankruptcy at the moment.
- The Altman-Z score of FHI (4.85) is better than 86.55% of its industry peers.
- The Debt to FCF ratio of FHI is 1.02, which is an excellent value as it means it would take FHI, only 1.02 years of fcf income to pay off all of its debts.
- The Debt to FCF ratio of FHI (1.02) is better than 87.00% of its industry peers.
- FHI has a Debt/Equity ratio of 0.32. This is a healthy value indicating a solid balance between debt and equity.
- FHI has a better Debt to Equity ratio (0.32) than 75.78% of its industry peers.
- FHI has a Current Ratio of 2.70. This indicates that FHI is financially healthy and has no problem in meeting its short term obligations.
- FHI has a Current ratio of 2.70. This is in the better half of the industry: FHI outperforms 77.58% of its industry peers.
- FHI has a Quick Ratio of 2.70. This indicates that FHI is financially healthy and has no problem in meeting its short term obligations.
- FHI's Quick ratio of 2.70 is fine compared to the rest of the industry. FHI outperforms 78.03% of its industry peers.
Deciphering NYSE:FHI's Growth Rating
ChartMill assigns a Growth Rating to every stock. This score ranges from 0 to 10 and evaluates the different growth aspects like EPS and Revenue, both in the past as in the future. NYSE:FHI scores a 4 out of 10:
- The Earnings Per Share is expected to grow by 9.88% on average over the next years. This is quite good.
- When comparing the EPS growth rate of the last years to the growth rate of the upcoming years, we see that the growth is accelerating.
Our Decent Value screener lists more Decent Value stocks and is updated daily.
Our latest full fundamental report of FHI contains the most current fundamental analsysis.
Disclaimer
This is not investing advice! The article highlights some of the observations at the time of writing, but you should always make your own analysis and invest based on your own insights.