
FirstEnergy Corp (NYSE:FE) has appeared as a notable candidate in our daily technical breakout screening process. This process finds stocks displaying both solid basic technical condition and consolidation patterns that indicate possible breakout chances. The method uses ChartMill's own Technical Rating, which assesses general trend condition and momentum, with the Setup Quality Rating that examines how narrowly a stock has been trading lately. Stocks ranking well in both areas frequently offer good risk-reward situations for technical traders searching for confirmed trends starting new momentum stages.
Technical Condition Evaluation
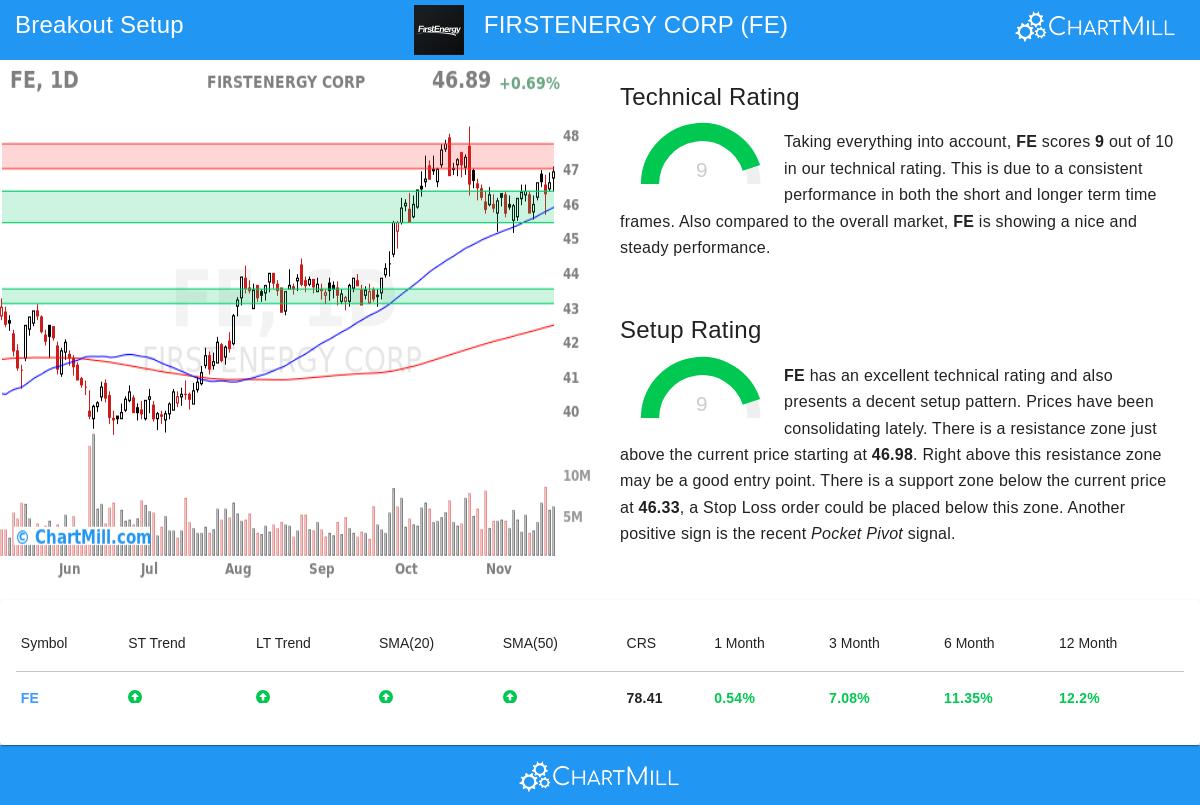
FirstEnergy shows very good technical foundations, receiving a full 9 out of 10 Technical Rating according to the detailed technical analysis report. This high rating shows several favorable technical features that match the breakout strategy's need for stocks with confirmed upward momentum. The utility company displays steady condition across different time periods and technical measures:
- Both long-term and short-term trends are clearly positive, showing continued buying interest
- The stock performs better than 78% of all stocks in yearly results with steady price gains
- All important moving averages (20-day through 200-day) are increasing and placed below the present price
- Relative condition measures show FE trading in the higher part of its 52-week range along with the wider market
This technical soundness is important for breakout strategies because it confirms the stock has basic momentum that might push prices upward once consolidation finishes. Stocks with lower technical ratings often miss the institutional backing required for continued breakouts.
Setup Condition and Consolidation Pattern
With a Setup Rating of 9 out of 10, FirstEnergy shows what technical analysts would call a very good consolidation pattern. The stock has been trading in a narrow band between $45.13 and $47.05 over the last month, forming a clear base. This tightening in price activity often comes before notable directional movements. Several elements add to the high setup condition:
- Prices are consolidating close to recent highs with reducing volatility
- Several support levels are present below current prices, offering clear stop-loss zones
- A recent pocket pivot signal shows institutional buying
- Resistance is clearly specified between $46.98 and $47.70
For breakout traders, this kind of setup gives well-defined risk limits. The nearness to resistance allows for exact entry points, while the stacked support structure permits reasonable stop-loss positioning.
Trading Meaning and Market Situation
FirstEnergy's technical profile becomes especially notable when looking at the present market conditions. While the S&P 500 displays a negative long-term trend, FE keeps positive trends across all time periods, showing relative condition. The utility sector usually displays defensive traits, but FE's technical results indicate it is drawing momentum investors too. The stock's average daily volume of about 4.7 million shares gives enough liquidity for position entry and exit without major price differences.
The mix of sound technical condition and narrow consolidation makes FE a possibility for traders watching for breakout confirmation. The proposed entry above $47.71 would show a move through the specified resistance area, while support near $45.42-$46.33 offers a reasonable zone for risk control.
Locating Other Possibilities
The Technical Breakout Screen that found FirstEnergy is refreshed daily with new possible setups. Investors searching for comparable chances can access the current screening results here to see the newest stocks fitting these technical requirements. Regular checking of these setups can assist technical traders in finding developing patterns before major movements happen.
Disclaimer: This examination is based on technical measures and historical price patterns and should not be taken as investment advice. Always perform your own research, think about your risk tolerance, and talk with a financial advisor before making investment choices. Technical analysis does not assure future results and should be used as one instrument within a full investment plan.
