
For investors looking to balance the search for growth with a degree of caution, the "Growth at a Reasonable Price" (GARP) method presents a practical middle path. This method tries to find companies with good and lasting growth, but whose shares are not valued at the high levels seen with aggressive momentum stocks. By concentrating on businesses with sound basic operations, including good balance sheets and strong profitability, the method works to reduce risk while still taking part in rising earnings paths. One stock that recently came up using this sort of filter is EXLService Holdings Inc (NASDAQ:EXLS).
A Look at Growth and Value
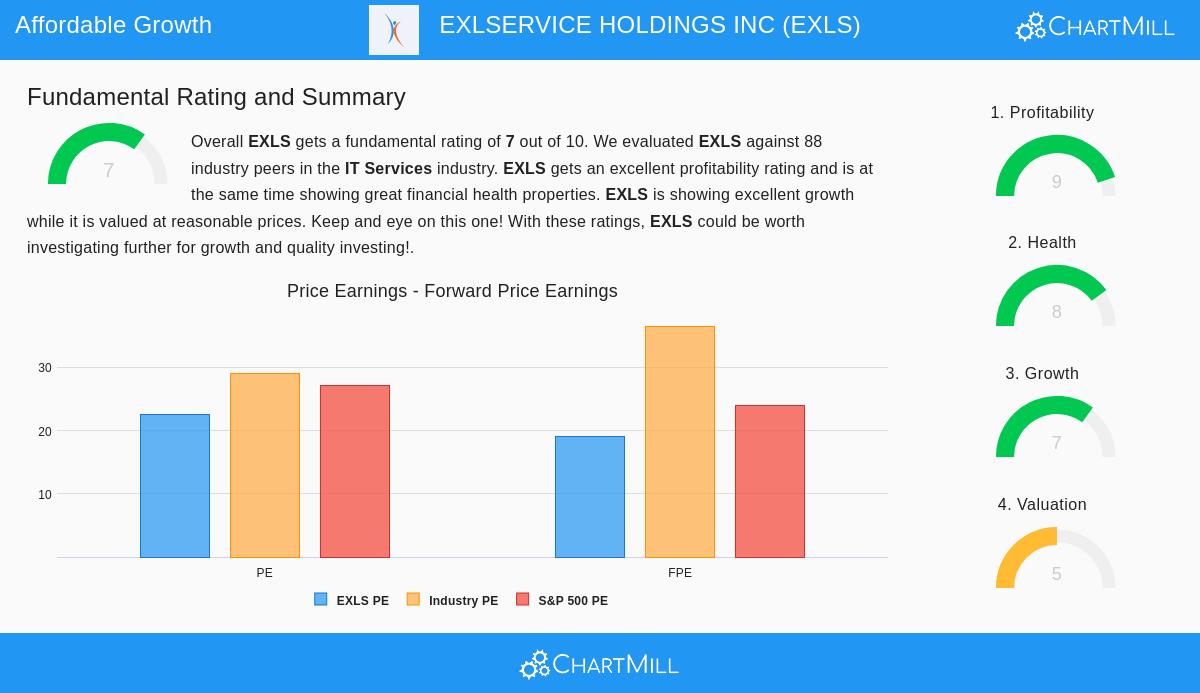
The central idea of a reasonable growth filter is to locate companies where the growth narrative is strong but not completely represented in a high stock price. EXLService Holdings, a worldwide operations management and analytics company, seems to fit this idea. Based on its fundamental analysis report, EXLS gets a good total score of 7 out of 10, with its most significant positives found in its operational performance rather than uncertain future prospects.
Growth Path: A Score of 7 The company's growth measurements are a main positive. The analysis points to a steady and notable history:
- Earnings Per Share (EPS) increased by 20.38% over the previous year and has seen an average yearly growth rate of 21.93% over the last several years.
- Revenue rose by 14.43% in the last year, with an average yearly growth of 13.15% in the past.
- Moving forward, analysts think this pace will persist, with estimated EPS growth of 15.66% and revenue growth of 12.05% each year.
This steady double-digit growth in both revenue and earnings gives a solid base for the investment case, going past excitement to shown business growth.
Valuation Setting: A Score of 5 While growth is necessary, its price is also key for GARP investors. EXLS's valuation score of 5 indicates a neutral to fair standing, particularly when considered in comparison.
- The company's Price-to-Earnings (P/E) ratio of 22.58 is somewhat high on its own but seems more fair relative to its industry and the wider market. It is less expensive than about 64% of similar companies in the IT Services industry and is similar to the S&P 500 average.
- In the same way, its forward P/E ratio of 19.10 shows a valuation that is a little less costly than many industry rivals and the wider market.
- Importantly, the analysis states that the company's very good profitability and anticipated earnings growth could support its current valuation levels, suggesting the market is not paying too much for static operations but for a growing, profitable business.
The Basic Strengths: Profitability and Financial Soundness
A reasonable growth stock must be more than just low-priced and growing; it requires the basic strength to maintain that growth. This is where EXLS's outline gets especially interesting. Its high scores in profitability and financial soundness lower the risk linked to its growth goals.
Very Good Profitability: A Score of 9 EXLS works with notable efficiency, putting it with the better performers in its field.
- Important return measurements are strong: a Return on Assets of 13.93%, a Return on Equity of 25.35%, and a Return on Invested Capital of 16.51% all place in the better part of the industry.
- The company keeps good and widening margins. Its Operating Margin of 15.15% and Profit Margin of 11.91% have both gotten better lately and do better than a large portion of industry peers.
This high profitability score is important for the GARP method. It shows that the company's growth is not being driven by careless spending or debt but is producing real returns on its capital, creating actual shareholder value.
Good Financial Soundness: A Score of 8 A strong balance sheet gives the stability to handle economic declines and put money into future chances. EXLS shows clear financial durability.
- Liquidity is good, with a Current Ratio and Quick Ratio both at 2.91, showing enough ability to meet near-term needs and doing better than more than three-quarters of its industry.
- Solvency is stable, with an acceptable Debt-to-Equity ratio of 0.37 and a very good Altman-Z score of 8.55, indicating a very low near-term chance of financial trouble.
- The company produces more than sufficient free cash flow to handle its debt, with a Debt-to-Free-Cash-Flow ratio of only 1.24 years.
This financial soundness is a protective support for investors. It means the company's growth plans are supported by a safe financial foundation, lessening the risk that a stricter credit market or economic drop could stop its advance.
Summary and Additional Study
EXLService Holdings Inc shows an example of the reasonable growth model. It joins a clear, double-digit growth path in both revenue and earnings with a valuation that is fair within its competitive and market setting. More significantly, this growth is supported by a base of very good profitability and very stable financial soundness, tackling main risk elements that growth investors frequently encounter. The company’s basic outline suggests it is growing not by giving up balance sheet strength, but by effectively using capital and performing its business plan well.
For investors wanting to examine other companies that match this outline of good growth, fair valuation, and sound basics, more outcomes can be seen by checking the Affordable Growth stock screen.
Disclaimer: This article is for information only and is not financial advice, a suggestion to buy or sell any security, or a support of any investment plan. Investors should do their own study and think about their personal financial situation and risk tolerance before making any investment choices.