
Consider EXELIXIS INC (NASDAQ:EXEL) as an affordable growth stock, identified by our stock screening tool. EXEL is showcasing impressive growth figures and is well-positioned in terms of profitability, solvency, and liquidity. Moreover, it seems to be priced reasonably. Let's dive deeper into the analysis.
Understanding EXEL's Growth Score
ChartMill assigns a Growth Rating to each stock, ranging from 0 to 10. This rating is determined by analyzing different growth elements, including EPS and revenue growth, spanning both historical and future figures. In the case of EXEL, the assigned 8 reflects its growth potential:
- EXEL shows a strong growth in Earnings Per Share. In the last year, the EPS has been growing by 189.06%, which is quite impressive.
- Measured over the past years, EXEL shows a quite strong growth in Earnings Per Share. The EPS has been growing by 12.65% on average per year.
- The Revenue has grown by 18.50% in the past year. This is quite good.
- EXEL shows quite a strong growth in Revenue. Measured over the last years, the Revenue has been growing by 17.51% yearly.
- EXEL is expected to show a strong growth in Earnings Per Share. In the coming years, the EPS will grow by 24.81% yearly.
- Based on estimates for the next years, EXEL will show a quite strong growth in Revenue. The Revenue will grow by 10.38% on average per year.
- When comparing the EPS growth rate of the last years to the growth rate of the upcoming years, we see that the growth is accelerating.
How do we evaluate the Valuation for EXEL?
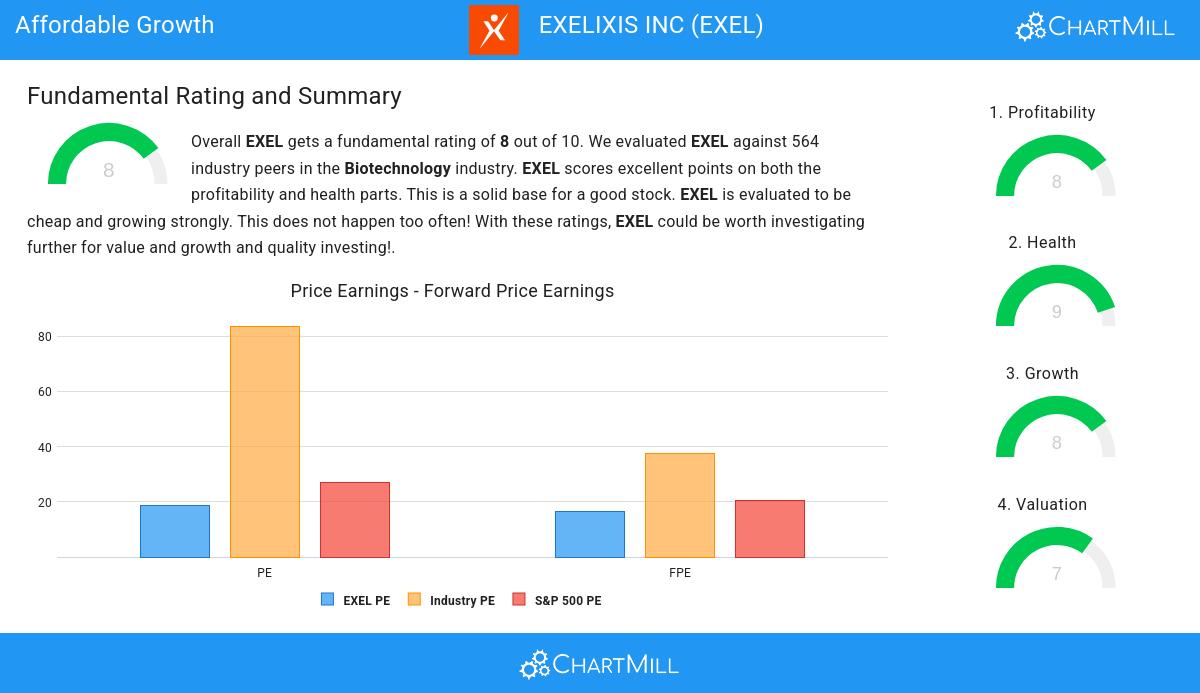
ChartMill employs its own Valuation Rating system for all stocks. This score, ranging from 0 to 10, is determined by evaluating different valuation factors, including price to earnings and free cash flow, both in absolute terms and relative to the market and industry. EXEL has earned a 7 for valuation:
- Based on the Price/Earnings ratio, EXEL is valued cheaper than 96.28% of the companies in the same industry.
- EXEL's Price/Earnings ratio indicates a valuation a bit cheaper than the S&P500 average which is at 27.10.
- Compared to the rest of the industry, the Price/Forward Earnings ratio of EXEL indicates a rather cheap valuation: EXEL is cheaper than 94.68% of the companies listed in the same industry.
- Based on the Enterprise Value to EBITDA ratio, EXEL is valued cheaper than 96.63% of the companies in the same industry.
- Based on the Price/Free Cash Flow ratio, EXEL is valued cheaper than 96.81% of the companies in the same industry.
- The excellent profitability rating of EXEL may justify a higher PE ratio.
- EXEL's earnings are expected to grow with 20.67% in the coming years. This may justify a more expensive valuation.
Exploring EXEL's Health
ChartMill employs its own Health Rating for stock assessment. This rating, ranging from 0 to 10, is calculated by examining various liquidity and solvency ratios. In the case of EXEL, the assigned 9 reflects its health status:
- An Altman-Z score of 10.65 indicates that EXEL is not in any danger for bankruptcy at the moment.
- Looking at the Altman-Z score, with a value of 10.65, EXEL belongs to the top of the industry, outperforming 89.36% of the companies in the same industry.
- There is no outstanding debt for EXEL. This means it has a Debt/Equity and Debt/FCF ratio of 0 and it is amongst the best of the sector and industry.
- EXEL has a Current Ratio of 3.63. This indicates that EXEL is financially healthy and has no problem in meeting its short term obligations.
- A Quick Ratio of 3.58 indicates that EXEL has no problem at all paying its short term obligations.
A Closer Look at Profitability for EXEL
ChartMill assigns a Profitability Rating to every stock. This score ranges from 0 to 10 and evaluates the different profitability ratios and margins, both absolutely, but also relative to the industry peers. EXEL scores a 8 out of 10:
- EXEL's Return On Assets of 17.68% is amongst the best of the industry. EXEL outperforms 97.87% of its industry peers.
- EXEL has a better Return On Equity (23.23%) than 97.87% of its industry peers.
- EXEL has a better Return On Invested Capital (21.31%) than 98.58% of its industry peers.
- The 3 year average ROIC (10.78%) for EXEL is below the current ROIC(21.31%), indicating increased profibility in the last year.
- EXEL has a Profit Margin of 24.04%. This is amongst the best in the industry. EXEL outperforms 97.34% of its industry peers.
- With an excellent Operating Margin value of 31.81%, EXEL belongs to the best of the industry, outperforming 98.40% of the companies in the same industry.
- The Gross Margin of EXEL (96.49%) is better than 95.39% of its industry peers.
Every day, new Affordable Growth stocks can be found on ChartMill in our Affordable Growth screener.
For an up to date full fundamental analysis you can check the fundamental report of EXEL
Disclaimer
This is not investing advice! The article highlights some of the observations at the time of writing, but you should always make your own analysis and invest based on your own insights.