
Technical analysis investors often look for stocks displaying both solid basic momentum and defined consolidation patterns that indicate possible breakouts. One methodical process uses filters to find securities with high technical ratings, showing good price trends, combined with high setup quality scores, which point to orderly price consolidation. This process tries to find technically good stocks that are also creating patterns providing acceptable risk-reward entry points.
Technical Strength Assessment
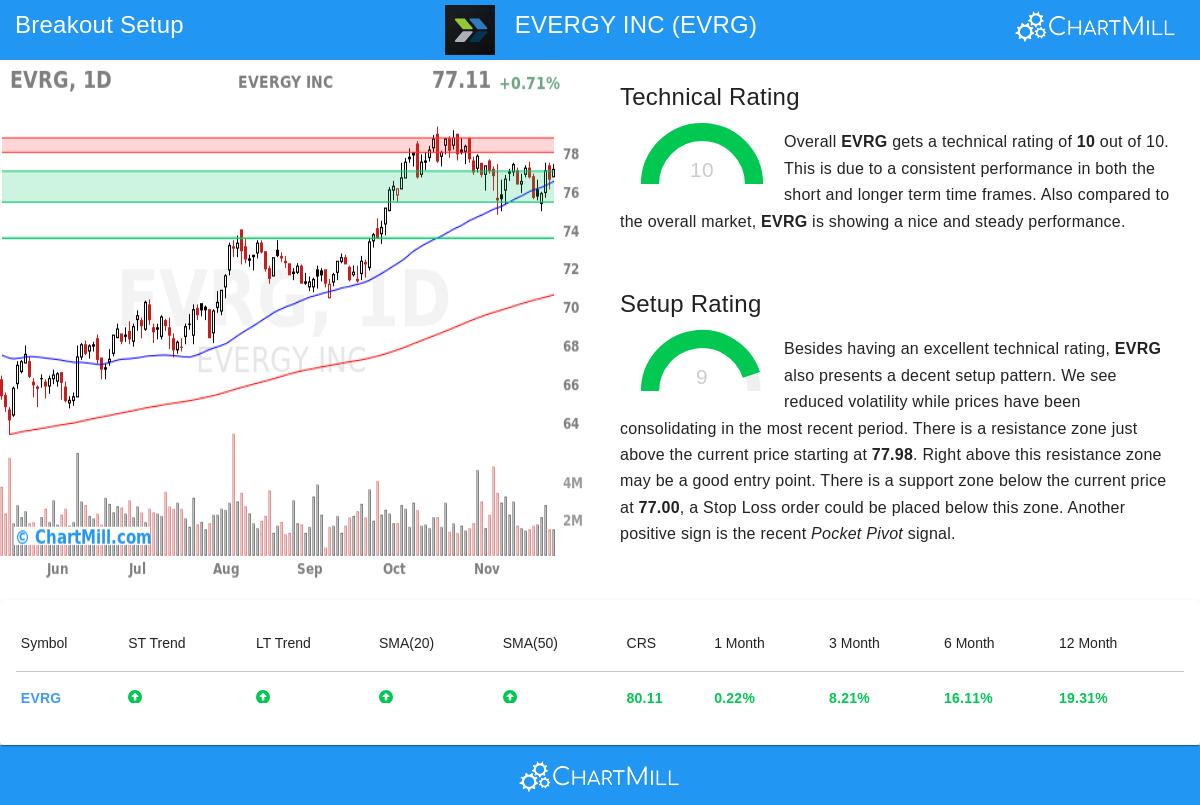
EVERGY INC (NASDAQ:EVRG) shows notable technical features according to its technical analysis report, receiving a complete technical rating of 10 out of 10. This high score indicates broad strength across different timeframes and technical measures. The utility company shows steady upward momentum with both short-term and long-term trends evaluated as positive, a key base for breakout possibilities because existing trends often continue.
The stock's technical soundness includes more than basic price gains:
- All main moving averages (20, 50, 100, and 200-day) are moving upward with the present price trading above each
- Relative strength is better than 80% of all stocks in the market
- Performance compared to its industry puts it in front of 73% of electric utility companies
- Steady increases across various time periods: 8.2% over three months and 19.3% over twelve months
This technical base is important for breakout methods because stocks with solid basic momentum have a higher chance of maintaining breakouts instead of having false breakouts that rapidly change direction. The broad technical strength indicates institutional backing and continued buyer activity, both necessary elements for successful breakout continuation.
Setup Quality and Consolidation Pattern
Besides technical strength, EVRG shows very good setup quality with a rating of 9 out of 10, showing the stock has been moving in a narrow range that often comes before notable price moves. The recent trading activity shows price pressure between $74.76 and $77.89 over the last month, with volatility decreasing visibly. This consolidation inside a set uptrend creates the possible force for a clear breakout.
The setup offers distinct technical points for trade management:
- Resistance area between $77.98 and $78.73 marks the nearby breakout point
- Support area between $75.39 and $77.00 gives a sensible stop-loss location
- Recent pocket pivot signal shows buying at present levels
- Average True Range of 1.12 points gives a quantifiable volatility measure for deciding position size
The value of this setup is especially important because it allows for accurate entry and risk control. The well-marked resistance point gives a clear breakout signal, while the set support area below present prices lets traders position stop-loss orders with technical reasoning instead of random percentages. This organized method helps control risk while taking part in possible upward continuation.
Market Context and Implementation
While EVRG displays its own strength, it is important to recognize the wider market situation with the S&P 500 showing a positive short-term trend next to a neutral long-term view. This situation can be supportive for stock-specific breakouts, especially for set companies like Evergy that supply necessary services and show technical leadership inside their sector.
For traders using this setup, the technical report indicates:
- Entry above $78.74 to validate breakout through resistance
- Stop-loss below $75.38 to control risk on unsuccessful breakout
- Position sizing decided by the 4.27% risk per share and personal portfolio risk limits
The pairing of a complete technical rating and high setup quality makes EVRG worth notice for technical traders looking for breakout chances in set, moving names with defined risk measures.
Discover More Breakout Opportunities
The Technical Breakout Setups filter that found EVRG is refreshed each day with new possible trading ideas. Investors can access the current screening results to examine other securities meeting these technical requirements.
Disclaimer: This analysis is for informational purposes only and does not constitute investment advice, recommendation, or solicitation to buy or sell any securities. All investments involve risk, including possible loss of principal. Investors should conduct their own research and consult with a qualified financial advisor before making any investment decisions. Technical analysis is not a perfect tool and past performance does not guarantee future results.