
EVERGY INC (NASDAQ:EVRG) was identified as a Technical Breakout Setup Pattern by our stockscreener. Such a pattern occurs when we see a pause in a strong uptrend: after a strong rise the stock is consolidating a bit and at some point the trend may be continued. Whether this actually happens can not be predicted of course, but it may be a good idea to keep and eye on NASDAQ:EVRG.
Technical Analysis Observations
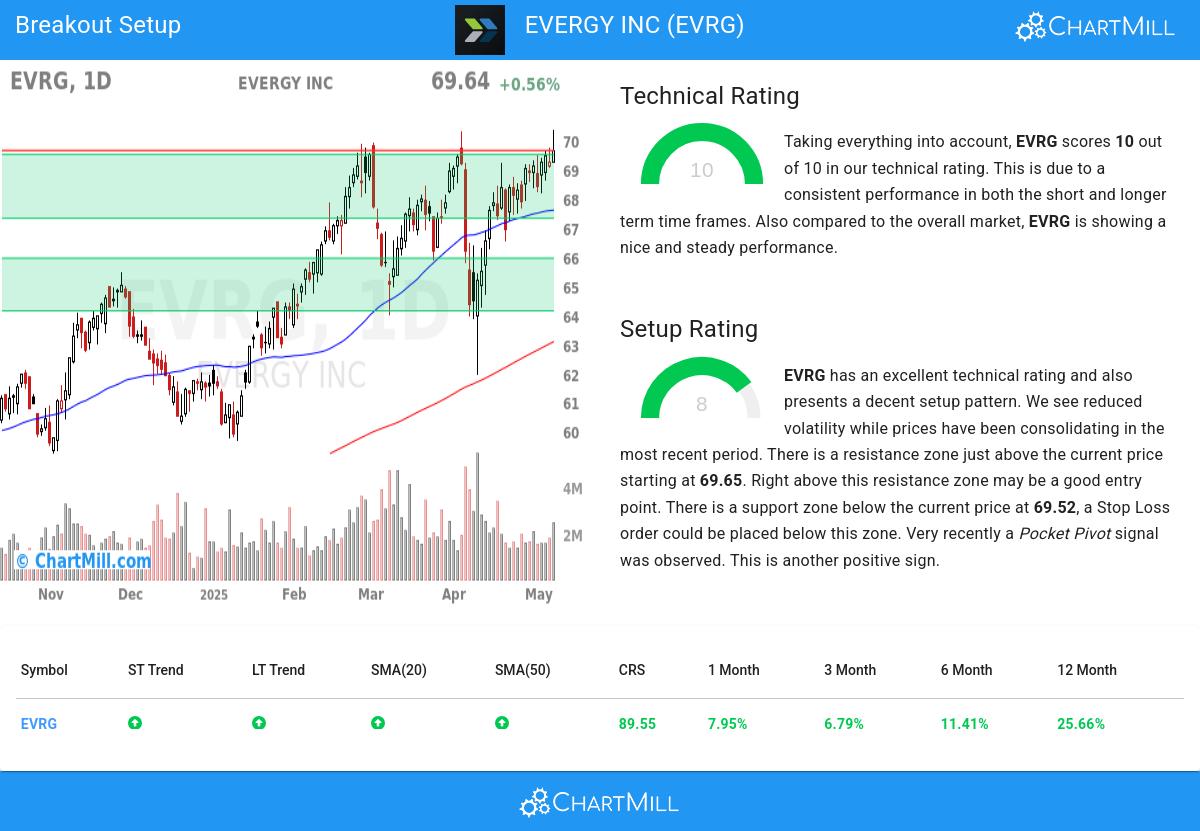
ChartMill assigns a Technical Rating to every stock. This score ranges from 0 to 10 and is updated daily. The score is determined by evaluating multiple technical indicators and properties.
We assign a technical rating of 10 out of 10 to EVRG. Both in the recent history as in the last year, EVRG has proven to be a steady performer, scoring decent points in every aspect analyzed.
- Both the short term and long term trends are positive. This is a very positive sign.
- Looking at the yearly performance, EVRG did better than 89% of all other stocks. We also observe that the gains produced by EVRG over the past year are nicely spread over this period.
- EVRG is one of the better performing stocks in the Electric Utilities industry, it outperforms 73% of 46 stocks in the same industry.
- A new 52 week high is currently being made by EVRG, which is a very good signal! Especially since the S&P500 is only trading in the middle part of its 52 week range, so EVRG is leading the market.
- In the last month EVRG has a been trading in the 61.94 - 70.36 range, which is quite wide. It is currently trading near the high of this range.
Our latest full technical report of EVRG contains the most current technical analsysis.
Why is EVRG a setup?
Next to the Technical Rating, the Setup Rating of a stock determines to which extend the stock is consolidating. This score also ranges from 0 to 10 and is updated daily. The setup score evaluates various short term technical indicators. For EVRG this score is currently 8:
EVRG has an excellent technical rating and also presents a decent setup pattern. Prices have been consolidating lately and the volatility has been reduced. There is a resistance zone just above the current price starting at 69.65. Right above this resistance zone may be a good entry point. There is a support zone below the current price at 69.52, a Stop Loss order could be placed below this zone. Another positive sign is the recent Pocket Pivot signal.
How to trade EVRG?
A breakout opportunity may arise when the stock surpasses the current consolidation zone and reaches new highs. Traders often wait for this breakout before considering buying the stock. To manage risk, a stop loss order could be placed below the consolidation zone to limit potential losses.
Please note that this article should not be construed as trading advice. The information provided is solely based on automated technical analysis and serves to highlight technical observations. It is important to conduct your own analysis and make trading decisions based on your own judgment and responsibility.
Our Breakout screener lists more breakout setups and is updated daily.
Disclaimer
This is not investing advice! The article highlights some of the observations at the time of writing, but you should always make your own analysis and invest based on your own insights.