
Our stock screener has identified EVERGY INC (NASDAQ:EVRG) as a potential breakout candidate. This technical breakout setup pattern occurs when the stock consolidates after a strong uptrend. While the actual breakout is uncertain, it may be worth keeping an eye on NASDAQ:EVRG.
Technical Analysis Observations
ChartMill employs a sophisticated system to assign a Technical Rating to every stock in its analysis. This rating, which ranges from 0 to 10, is determined by carefully assessing multiple technical indicators and properties.
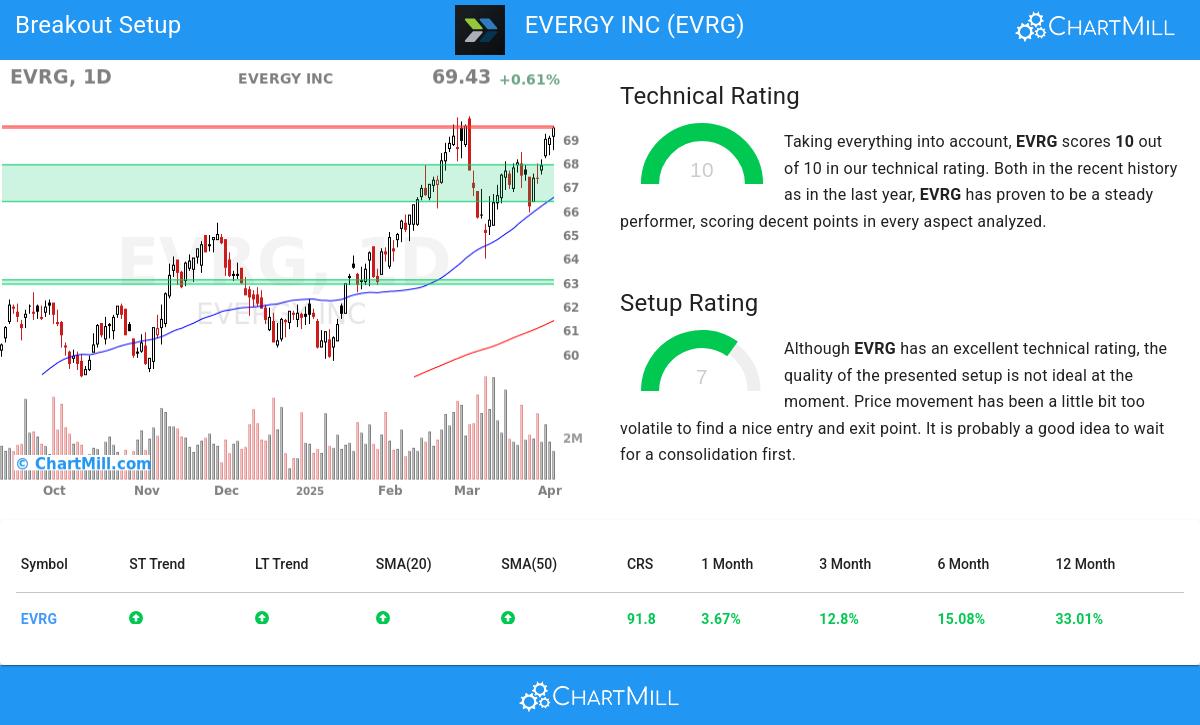
Taking everything into account, EVRG scores 10 out of 10 in our technical rating. Both in the recent history as in the last year, EVRG has proven to be a steady performer, scoring decent points in every aspect analyzed.
- The long and short term trends are both positive. This is looking good!
- Looking at the yearly performance, EVRG did better than 91% of all other stocks. We also observe that the gains produced by EVRG over the past year are nicely spread over this period.
- EVRG is part of the Electric Utilities industry. There are 46 other stocks in this industry. EVRG outperforms 88% of them.
- EVRG is currently trading near its 52 week high. This is a good sign, certainly because the S&P500 Index is not trading near new highs.
- In the last month EVRG has a been trading in the 63.98 - 69.52 range, which is quite wide. It is currently trading near the high of this range.
Our latest full technical report of EVRG contains the most current technical analsysis.
How do we evaluate the setup for EVRG?
Next to the Technical Rating, the Setup Rating of a stock determines to which extend the stock is consolidating. This score also ranges from 0 to 10 and is updated daily. The setup score evaluates various short term technical indicators. For EVRG this score is currently 7:
EVRG has an excellent technical rating, but the quality of the setup is only medium at the moment. Price movement has been a little bit too volatile to find a nice entry and exit point. It is probably a good idea to wait for a consolidation first.
Trading breakout setups.
For a potential trade one would typically wait until the stock breaks out of the consolidation zone to enter the stock and it could be sold again for a loss when it would fall back below the zone.
Of course, there are many ways to trade or not trade EVRG and this article should in no way be interpreted as trading advice. The article is purely based on an automated technical analysis and just points out the technical observations. Always make your own analysis and trade at your own responsibility.
Our Breakout screener lists more breakout setups and is updated daily.
Keep in mind
This is not investing advice! The article highlights some of the observations at the time of writing, but you should always make your own analysis and invest based on your own insights.