
A possible breakout setup was detected on EVERGY INC (NASDAQ:EVRG) by our stockscreener. A breakout pattern is formed when a stock consolidates after a strong rise up. We note that this pattern is detected purely based on technical analysis and whether the breakout actually materializes remains to be seen. It could be interesting to keep an eye on NASDAQ:EVRG.
In-Depth Technical Analysis of EVRG
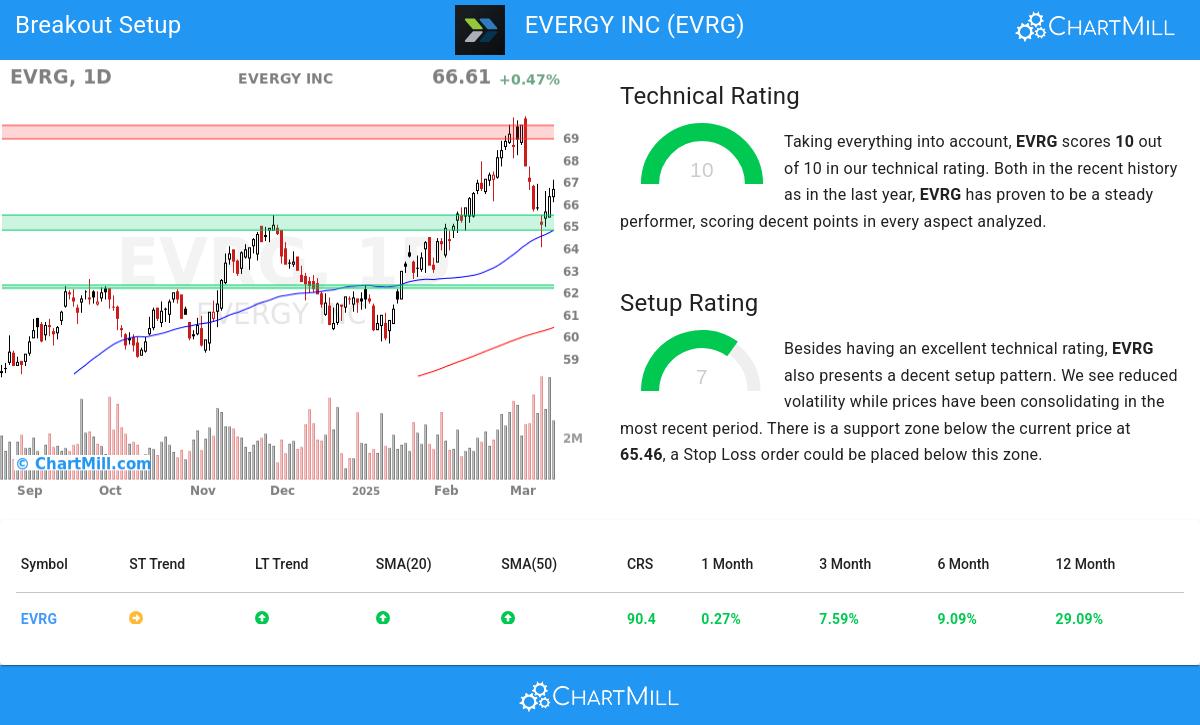
ChartMill assigns a Technical Rating to every stock. This score, ranging from 0 to 10, is updated daily and is determined by evaluating multiple technical indicators and properties.
Taking everything into account, EVRG scores 10 out of 10 in our technical rating. Both in the recent history as in the last year, EVRG has proven to be a steady performer, scoring decent points in every aspect analyzed.
- The short term is neutral, but the long term trend is still positive. Not much to worry about for now.
- When comparing the yearly performance of all stocks, we notice that EVRG is one of the better performing stocks in the market, outperforming 90% of all stocks. We also observe that the gains produced by EVRG over the past year are nicely spread over this period.
- EVRG is part of the Electric Utilities industry. There are 46 other stocks in this industry. EVRG outperforms 77% of them.
- EVRG is currently trading in the upper part of its 52 week range. The market is still in the middle of its 52 week range, so EVRG slightly outperforms the market at the moment.
- In the last month EVRG has a been trading in the 63.98 - 69.93 range, which is quite wide. It is currently trading in the middle of this range where prices have been consolidating recently, this may present a good entry opportunity, but some resistance may be present above.
- Volume is considerably higher in the last couple of days.
Our latest full technical report of EVRG contains the most current technical analsysis.
How do we evaluate the setup for EVRG?
ChartMill takes into account not only the Technical Rating but also assigns a Setup Rating to each stock. This rating, on a scale of 0 to 10, reflects the degree of consolidation observed based on short-term technical indicators. Currently, EVRG exhibits a 7 setup rating, indicating its consolidation status in recent days and weeks.
EVRG has an excellent technical rating and also presents a decent setup pattern. We see reduced volatility while prices have been consolidating in the most recent period. There is a support zone below the current price at 65.46, a Stop Loss order could be placed below this zone.
How can EVRG be traded?
One strategy to consider is waiting for the actual breakout to occur, where the stock breaks out above the current consolidation zone. Traders can then enter a buy position, anticipating further upward momentum. As a risk management measure, it is advisable to set a stop loss order below the consolidation zone.
Important Note: The content of this article is not intended as trading advice. It is essential to perform your own analysis and exercise caution when making trading decisions. The article presents technical observations generated by automated analysis but does not guarantee any trading outcomes. Always trade responsibly and make independent judgments.
Every day, new breakout setups can be found on ChartMill in our Breakout screener.
Keep in mind
Important Note: The content of this article is not intended as trading advice. It is essential to perform your own analysis and exercise caution when making trading decisions. The article presents observations created by automated analysis but does not guarantee any trading or investment outcomes. Always trade responsibly and make independent judgments.