
Growth investors are on the lookout for stocks displaying robust revenue and EPS growth. In this analysis, we'll assess whether EVERCORE INC - A (NYSE:EVR) aligns with growth investing criteria, especially as it consolidates and signals a possible breakout. As always, investors should conduct their own research, but EVERCORE INC - A has surfaced on our radar for growth with base formation, warranting further examination.
Evaluating Growth: EVR
Every stock receives a Growth Rating from ChartMill, ranging from 0 to 10. This rating assesses various growth aspects, including historical and projected EPS and revenue growth. EVR boasts a 8 out of 10:
- EVR shows a strong growth in Earnings Per Share. In the last year, the EPS has been growing by 67.71%, which is quite impressive.
- EVR shows a strong growth in Revenue. In the last year, the Revenue has grown by 22.67%.
- Measured over the past years, EVR shows a quite strong growth in Revenue. The Revenue has been growing by 8.11% on average per year.
- EVR is expected to show a strong growth in Earnings Per Share. In the coming years, the EPS will grow by 27.37% yearly.
- EVR is expected to show quite a strong growth in Revenue. In the coming years, the Revenue will grow by 13.56% yearly.
- When comparing the EPS growth rate of the last years to the growth rate of the upcoming years, we see that the growth is accelerating.
- When comparing the Revenue growth rate of the last years to the growth rate of the upcoming years, we see that the growth is accelerating.
Assessing Health Metrics for EVR
ChartMill employs a unique Health Rating system for all stocks. This rating, ranging from 0 to 10, is determined by analyzing various liquidity and solvency ratios. For EVR, the assigned 8 for health provides valuable insights:
- EVR has an Altman-Z score of 4.42. This indicates that EVR is financially healthy and has little risk of bankruptcy at the moment.
- EVR's Altman-Z score of 4.42 is amongst the best of the industry. EVR outperforms 84.42% of its industry peers.
- The Debt to FCF ratio of EVR is 0.39, which is an excellent value as it means it would take EVR, only 0.39 years of fcf income to pay off all of its debts.
- With an excellent Debt to FCF ratio value of 0.39, EVR belongs to the best of the industry, outperforming 89.18% of the companies in the same industry.
- A Debt/Equity ratio of 0.20 indicates that EVR is not too dependend on debt financing.
- The Debt to Equity ratio of EVR (0.20) is better than 77.06% of its industry peers.
- A Current Ratio of 2.43 indicates that EVR has no problem at all paying its short term obligations.
- Looking at the Current ratio, with a value of 2.43, EVR is in the better half of the industry, outperforming 77.49% of the companies in the same industry.
- EVR has a Quick Ratio of 2.43. This indicates that EVR is financially healthy and has no problem in meeting its short term obligations.
- Looking at the Quick ratio, with a value of 2.43, EVR is in the better half of the industry, outperforming 77.49% of the companies in the same industry.
Evaluating Profitability: EVR
Discover ChartMill's exclusive Profitability Rating, a proprietary metric that assesses stocks on a scale of 0 to 10. It takes into consideration various profitability ratios and margins, both in absolute terms and relative to industry peers. Notably, EVR has achieved a 7:
- Looking at the Return On Assets, with a value of 9.06%, EVR belongs to the top of the industry, outperforming 86.58% of the companies in the same industry.
- Looking at the Return On Equity, with a value of 22.15%, EVR belongs to the top of the industry, outperforming 90.91% of the companies in the same industry.
- EVR's Return On Invested Capital of 14.18% is amongst the best of the industry. EVR outperforms 90.04% of its industry peers.
- Measured over the past 3 years, the Average Return On Invested Capital for EVR is significantly above the industry average of 7.13%.
- EVR has a Gross Margin of 99.00%. This is amongst the best in the industry. EVR outperforms 99.57% of its industry peers.
How do we evaluate the setup for EVR?
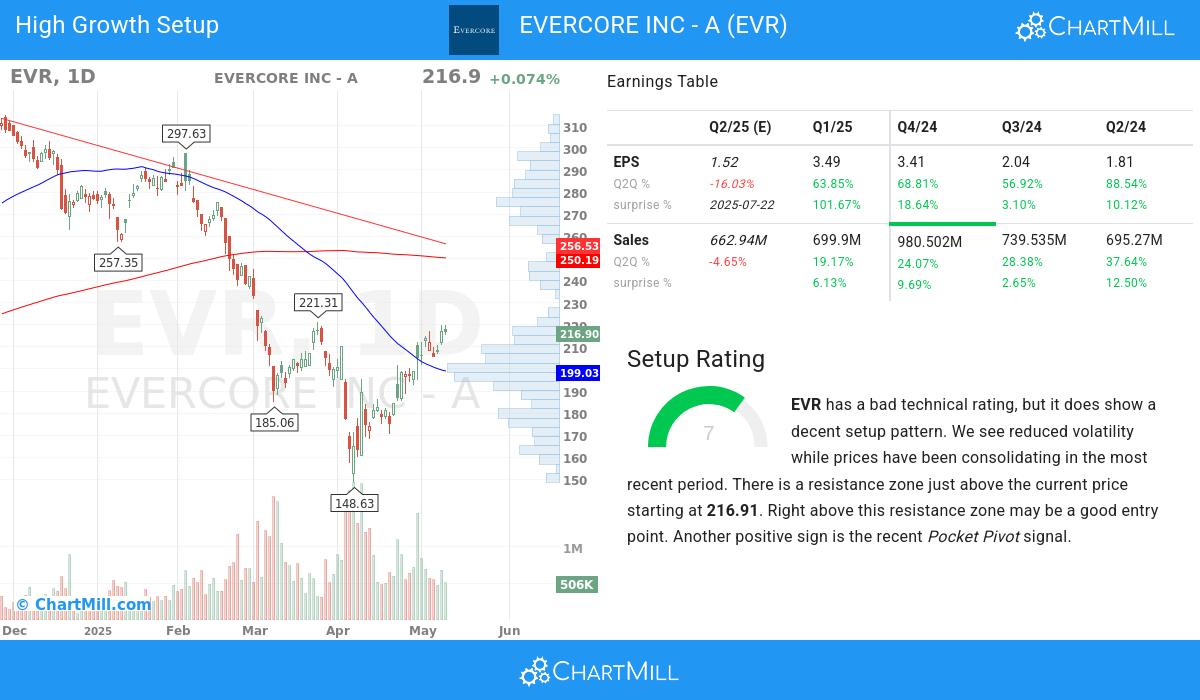
ChartMill also assign a Setup Rating to every stock. With this score it is determined to what extend the stock has been trading in a range in the recent days and weeks. This score also ranges from 0 to 10 and is updated daily. The setup score evaluates various short term technical indicators. EVR scores a 7 out of 10:
Although the technical rating is bad, EVR does present a nice setup opportunity. Prices have been consolidating lately and the volatility has been reduced. There is a resistance zone just above the current price starting at 216.91. Right above this resistance zone may be a good entry point. Very recently a Pocket Pivot signal was observed. This is another positive sign.
More Strong Growth stocks can be found in our Strong Growth screener.
Our latest full fundamental report of EVR contains the most current fundamental analsysis.
Check the latest full technical report of EVR for a complete technical analysis.
Disclaimer
This is not investing advice! The article highlights some of the observations at the time of writing, but you should always make your own analysis and invest based on your own insights.