
Our stock screening tool has pinpointed EVERCORE INC - A (NYSE:EVR) as a growth stock that isn't overvalued. NYSE:EVR is excelling in various growth indicators while maintaining a solid financial footing. Furthermore, it remains attractively priced. Let's delve into the specifics below.
Unpacking NYSE:EVR's Growth Rating
ChartMill assigns a Growth Rating to each stock, ranging from 0 to 10. This rating is determined by analyzing different growth elements, including EPS and revenue growth, spanning both historical and future figures. In the case of NYSE:EVR, the assigned 8 reflects its growth potential:
- EVR shows a strong growth in Earnings Per Share. In the last year, the EPS has been growing by 45.81%, which is quite impressive.
- The Revenue has grown by 22.67% in the past year. This is a very strong growth!
- Measured over the past years, EVR shows a quite strong growth in Revenue. The Revenue has been growing by 8.11% on average per year.
- The Earnings Per Share is expected to grow by 33.66% on average over the next years. This is a very strong growth
- The Revenue is expected to grow by 16.70% on average over the next years. This is quite good.
- When comparing the EPS growth rate of the last years to the growth rate of the upcoming years, we see that the growth is accelerating.
- The Revenue growth rate is accelerating: in the next years the growth will be better than in the last years.
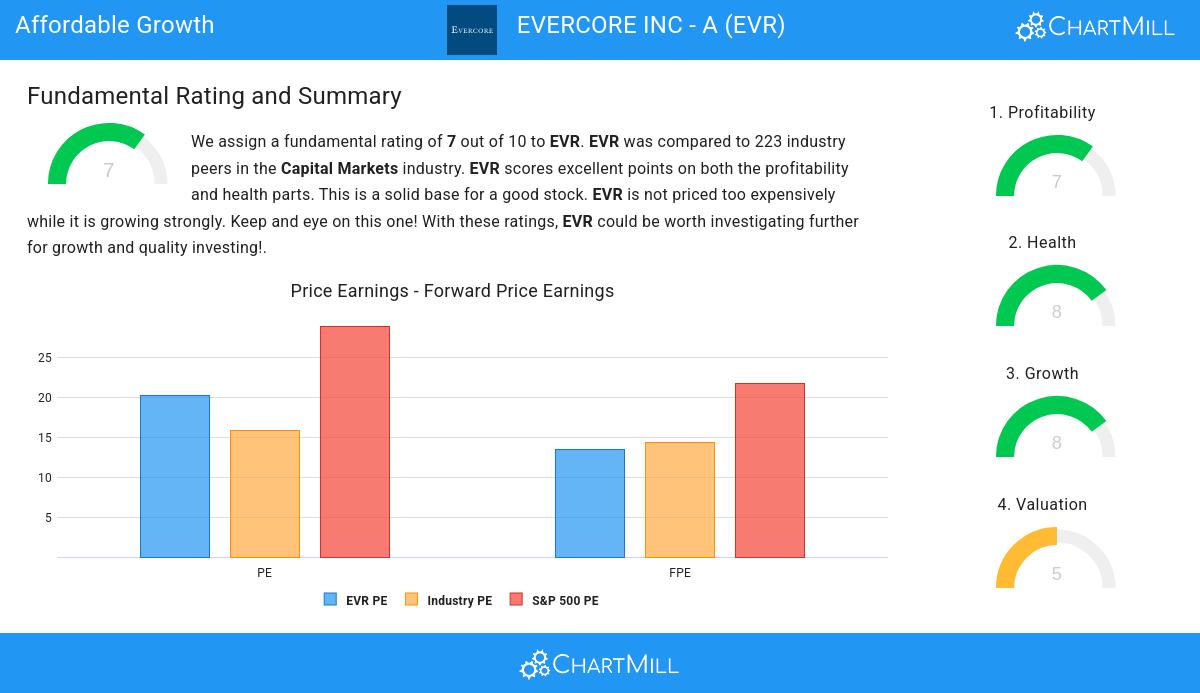
ChartMill's Evaluation of Valuation
An integral part of ChartMill's stock analysis is the Valuation Rating, which spans from 0 to 10. This rating evaluates diverse valuation factors, including price to earnings and cash flows, while considering the stock's profitability and growth. NYSE:EVR has received a 5 out of 10:
- EVR is valuated rather cheaply when we compare the Price/Earnings ratio to 28.93, which is the current average of the S&P500 Index.
- The average S&P500 Price/Forward Earnings ratio is at 21.69. EVR is valued slightly cheaper when compared to this.
- Compared to the rest of the industry, the Price/Free Cash Flow ratio of EVR indicates a somewhat cheap valuation: EVR is cheaper than 79.82% of the companies listed in the same industry.
- EVR's low PEG Ratio(NY), which compensates the Price/Earnings for growth, indicates a rather cheap valuation of the company.
- EVR has a very decent profitability rating, which may justify a higher PE ratio.
- EVR's earnings are expected to grow with 33.66% in the coming years. This may justify a more expensive valuation.
Looking at the Health
ChartMill employs its own Health Rating for stock assessment. This rating, ranging from 0 to 10, is calculated by examining various liquidity and solvency ratios. In the case of NYSE:EVR, the assigned 8 reflects its health status:
- EVR has an Altman-Z score of 4.17. This indicates that EVR is financially healthy and has little risk of bankruptcy at the moment.
- Looking at the Altman-Z score, with a value of 4.17, EVR belongs to the top of the industry, outperforming 85.65% of the companies in the same industry.
- The Debt to FCF ratio of EVR is 0.39, which is an excellent value as it means it would take EVR, only 0.39 years of fcf income to pay off all of its debts.
- The Debt to FCF ratio of EVR (0.39) is better than 89.69% of its industry peers.
- EVR has a Debt/Equity ratio of 0.20. This is a healthy value indicating a solid balance between debt and equity.
- EVR's Debt to Equity ratio of 0.20 is fine compared to the rest of the industry. EVR outperforms 78.03% of its industry peers.
- A Current Ratio of 2.43 indicates that EVR has no problem at all paying its short term obligations.
- The Current ratio of EVR (2.43) is better than 75.78% of its industry peers.
- EVR has a Quick Ratio of 2.43. This indicates that EVR is financially healthy and has no problem in meeting its short term obligations.
- EVR's Quick ratio of 2.43 is fine compared to the rest of the industry. EVR outperforms 75.78% of its industry peers.
Analyzing Profitability Metrics
ChartMill's Profitability Rating offers a unique perspective on stock analysis, providing scores from 0 to 10. These ratings consider a wide range of profitability metrics and margins, both in comparison to industry peers and on their own merits. For NYSE:EVR, the assigned 7 is a significant indicator of profitability:
- Looking at the Return On Assets, with a value of 9.06%, EVR belongs to the top of the industry, outperforming 85.20% of the companies in the same industry.
- Looking at the Return On Equity, with a value of 22.15%, EVR belongs to the top of the industry, outperforming 90.13% of the companies in the same industry.
- EVR has a Return On Invested Capital of 14.18%. This is amongst the best in the industry. EVR outperforms 90.58% of its industry peers.
- EVR had an Average Return On Invested Capital over the past 3 years of 15.25%. This is significantly above the industry average of 7.05%.
- EVR's Gross Margin of 99.00% is amongst the best of the industry. EVR outperforms 99.55% of its industry peers.
More Affordable Growth stocks can be found in our Affordable Growth screener.
For an up to date full fundamental analysis you can check the fundamental report of EVR
Disclaimer
This is not investing advice! The article highlights some of the observations at the time of writing, but you should always make your own analysis and invest based on your own insights.