
Technical analysis investors often look for stocks showing both good momentum and consolidation patterns that indicate possible breakouts. One method uses ChartMill's Technical Rating, which assesses overall technical condition, and its Setup Quality Rating, which finds consolidation patterns that provide good entry points. Stocks with high scores in both areas usually represent companies in good technical shape that are ready for possible upward moves.
Technical Strength Assessment
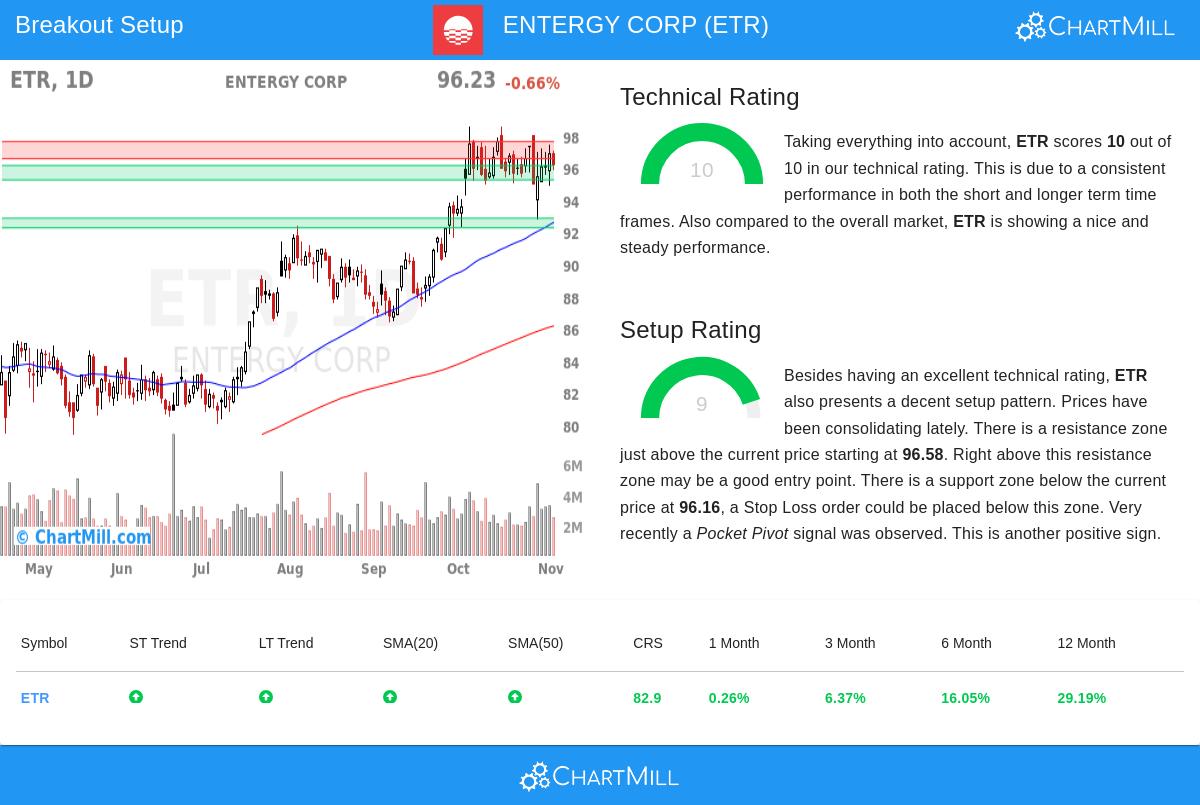
Entergy Corp (NYSE:ETR) shows very good technical features with a top Technical Rating of 10. This highest score shows good condition in several technical areas that are important for finding market leaders. The rating process looks at relative strength, trend direction, moving average location, and past performance patterns to measure a stock's technical condition.
Important technical features supporting ETR's top rating include:
- Both long-term and short-term trends are positive, showing continued upward momentum
- The stock performs better than 82% of all stocks over the last year with gains spread across the time
- Good relative strength in the Electric Utilities industry, performing better than 76% of sector companies
- Trading near its highest price in the last year along with general market strength
- All main moving averages (20-day to 200-day) are moving up and are located below the current price level
These features match the method's focus on finding stocks with clear upward paths, as high Technical Ratings usually go with continued uptrends and market leadership.
Setup Quality Analysis
Besides technical strength, ETR shows a good setup pattern with a Setup Quality Rating of 9. This high score means the stock has been moving in a small range, creating conditions good for a possible breakout entry. The setup assessment looks at nearness to moving averages, price tightness, support area clarity, and volatility features to find good entry chances.
The technical analysis report points out several setup benefits:
- Prices have been moving in a small range recently after good upward movement
- A clear resistance area exists between $96.58 and $97.65
- Several support areas provide clear stop-loss placement choices
- A recent pocket pivot signal shows institutional buying
- Current price action shows a bull flag pattern forming
This mix of technical strength and setup quality creates conditions where the stock has built good momentum but is currently pausing, possibly offering a good risk-reward entry point for breakout traders.
Trading Considerations
For investors using this method, the identified setup suggests specific price levels for possible action. The analysis points to a possible entry above resistance at $97.66 with a stop-loss below support at $95.25, representing about 2.5% risk on the trade. The closeness of the current price to these levels makes this an active setup to watch.
The existence of several support areas below the current price allows for flexibility in position size and risk management. The strongest support groups between $92.28-$92.88 and $85.96-$87.75, providing possible adjustment points for traders with different time frames or risk levels.
Market Context
ETR's technical strength happens within a good market environment where the S&P 500 shows positive trends in both short-term and long-term timeframes. The utility sector's defensive features combined with technical breakout patterns may have special interest for investors looking for relative stability with growth potential.
Daily trading volume averaging about 2.74 million shares provides enough liquidity for most institutional and individual investors, lowering execution difficulty and supporting technical pattern reliability.
Finding Additional Opportunities
The method that found ETR can be used in an organized way across the market. Investors looking for similar technical breakout setups can explore current opportunities through ChartMill's screening tools, which filter for stocks with both high technical ratings and good setup patterns.
Disclaimer: This analysis is based on technical indicators and pattern recognition and should not be considered investment advice. Always conduct your own research, consider your risk tolerance, and consult with financial professionals before making investment decisions. Technical analysis does not guarantee future performance and should be used as one component of a complete investment process.