
ENTERGY CORP (NYSE:ETR) was identified as a Technical Breakout Setup Pattern by our stockscreener. Such a pattern occurs when we see a pause in a strong uptrend: after a strong rise the stock is consolidating a bit and at some point the trend may be continued. Whether this actually happens can not be predicted of course, but it may be a good idea to keep and eye on NYSE:ETR.
Insights from Technical Analysis
Every day, ChartMill assigns a Technical Rating to each stock, providing a score ranging from 0 to 10. This rating is determined by evaluating various technical indicators and properties.
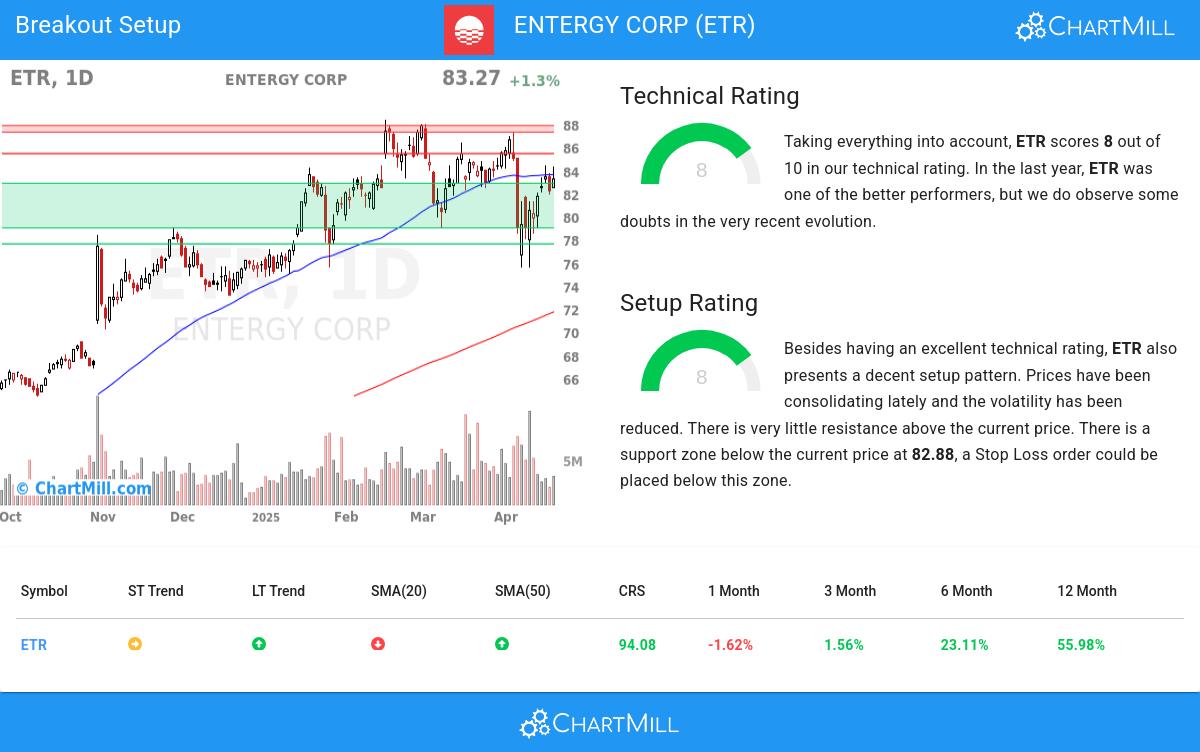
We assign a technical rating of 8 out of 10 to ETR. In the last year, ETR was one of the better performers, but we do observe some doubts in the very recent evolution.
- The long term trend is positive and the short term trend is neutral. The long term trend may just continue or reversal may be around the corner!
- Looking at the yearly performance, ETR did better than 94% of all other stocks. We also observe that the gains produced by ETR over the past year are nicely spread over this period.
- ETR is one of the better performing stocks in the Electric Utilities industry, it outperforms 93% of 46 stocks in the same industry.
- ETR is currently trading in the upper part of its 52 week range. The market is still in the middle of its 52 week range, so ETR slightly outperforms the market at the moment.
- In the last month ETR has a been trading in the 75.57 - 87.25 range, which is quite wide. It is currently trading in the middle of this range, so some resistance may be found above.
For an up to date full technical analysis you can check the technical report of ETR
How does the Setup look for ETR
Next to the Technical Rating, the Setup Rating of a stock determines to which extend the stock is consolidating. This score also ranges from 0 to 10 and is updated daily. The setup score evaluates various short term technical indicators. For ETR this score is currently 8:
Besides having an excellent technical rating, ETR also presents a decent setup pattern. Prices have been consolidating lately and the volatility has been reduced. There is very little resistance above the current price. There is a support zone below the current price at 82.88, a Stop Loss order could be placed below this zone.
Trading breakout setups.
One strategy to consider is waiting for the actual breakout to occur, where the stock breaks out above the current consolidation zone. Traders can then enter a buy position, anticipating further upward momentum. As a risk management measure, it is advisable to set a stop loss order below the consolidation zone.
Of course, there are many ways to trade or not trade ETR and this article should in no way be interpreted as trading advice. The article is purely based on an automated technical analysis and just points out the technical observations. Always make your own analysis and trade at your own responsibility.
More breakout setups can be found in our Breakout screener.
Disclaimer
This article should in no way be interpreted as advice. The article is based on the observed metrics at the time of writing, but you should always make your own analysis and trade or invest at your own responsibility.