
ESSENT GROUP LTD (NYSE:ESNT) has caught the attention of our stock screener as a great value stock. ESNT excels in profitability, solvency, and liquidity, all while being very reasonably priced. Let's delve into the details.
Assessing Valuation Metrics for ESNT
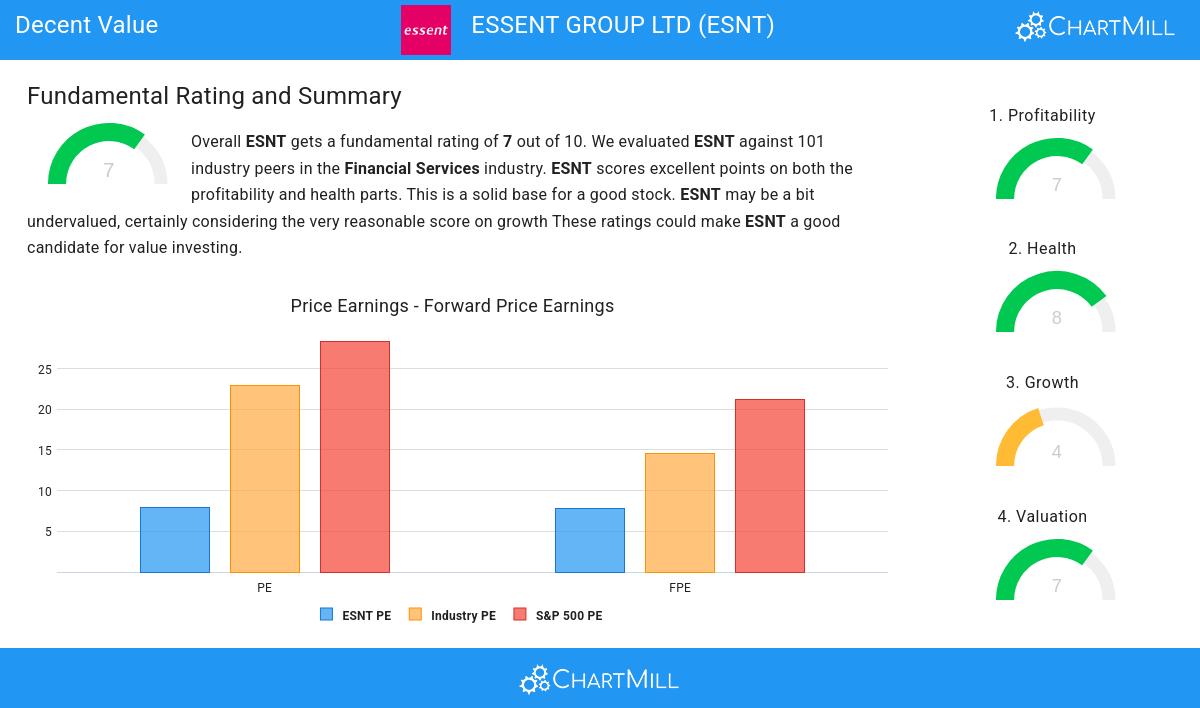
ChartMill provides a Valuation Rating to every stock, ranging from 0 to 10. This rating assesses various valuation aspects, comparing price to earnings and cash flows, while considering factors like profitability and growth. ESNT boasts a 7 out of 10:
- The Price/Earnings ratio is 7.90, which indicates a rather cheap valuation of ESNT.
- Based on the Price/Earnings ratio, ESNT is valued a bit cheaper than 78.22% of the companies in the same industry.
- ESNT is valuated cheaply when we compare the Price/Earnings ratio to 28.38, which is the current average of the S&P500 Index.
- The Price/Forward Earnings ratio is 7.75, which indicates a rather cheap valuation of ESNT.
- Based on the Price/Forward Earnings ratio, ESNT is valued a bit cheaper than 71.29% of the companies in the same industry.
- When comparing the Price/Forward Earnings ratio of ESNT to the average of the S&P500 Index (21.15), we can say ESNT is valued rather cheaply.
- Based on the Enterprise Value to EBITDA ratio, ESNT is valued cheaper than 87.13% of the companies in the same industry.
- Based on the Price/Free Cash Flow ratio, ESNT is valued cheaper than 84.16% of the companies in the same industry.
- ESNT has a very decent profitability rating, which may justify a higher PE ratio.
Understanding ESNT's Profitability
ChartMill utilizes a Profitability Rating to assess stocks, scoring them on a scale of 0 to 10. This rating takes into account a variety of profitability ratios and margins, both in absolute terms and in comparison to industry peers. ESNT has earned a 7 out of 10:
- ESNT has a Return On Assets of 10.26%. This is amongst the best in the industry. ESNT outperforms 88.12% of its industry peers.
- ESNT has a better Return On Invested Capital (10.91%) than 85.15% of its industry peers.
- The Average Return On Invested Capital over the past 3 years for ESNT is significantly above the industry average of 7.48%.
- The Profit Margin of ESNT (58.69%) is better than 96.04% of its industry peers.
- ESNT's Operating Margin of 71.67% is amongst the best of the industry. ESNT outperforms 94.06% of its industry peers.
Health Assessment of ESNT
ChartMill assigns a proprietary Health Rating to each stock. The score is computed by evaluating various liquidity and solvency ratios and ranges from 0 to 10. ESNT was assigned a score of 8 for health:
- ESNT has an Altman-Z score of 3.80. This indicates that ESNT is financially healthy and has little risk of bankruptcy at the moment.
- With an excellent Altman-Z score value of 3.80, ESNT belongs to the best of the industry, outperforming 88.12% of the companies in the same industry.
- ESNT has a debt to FCF ratio of 0.58. This is a very positive value and a sign of high solvency as it would only need 0.58 years to pay back of all of its debts.
- ESNT has a Debt to FCF ratio of 0.58. This is amongst the best in the industry. ESNT outperforms 88.12% of its industry peers.
- A Debt/Equity ratio of 0.09 indicates that ESNT is not too dependend on debt financing.
- With an excellent Debt to Equity ratio value of 0.09, ESNT belongs to the best of the industry, outperforming 83.17% of the companies in the same industry.
- ESNT has a Current Ratio of 2.77. This indicates that ESNT is financially healthy and has no problem in meeting its short term obligations.
- ESNT's Current ratio of 2.77 is amongst the best of the industry. ESNT outperforms 85.15% of its industry peers.
- ESNT has a Quick Ratio of 2.77. This indicates that ESNT is financially healthy and has no problem in meeting its short term obligations.
- ESNT has a better Quick ratio (2.77) than 86.14% of its industry peers.
Understanding ESNT's Growth
To evaluate a stock's growth potential, ChartMill utilizes a Growth Rating on a scale of 0 to 10. This comprehensive assessment considers various growth aspects, including historical and estimated EPS and revenue growth. ESNT has achieved a 4 out of 10:
- The Revenue has grown by 12.01% in the past year. This is quite good.
Our Decent Value screener lists more Decent Value stocks and is updated daily.
For an up to date full fundamental analysis you can check the fundamental report of ESNT
Keep in mind
This is not investing advice! The article highlights some of the observations at the time of writing, but you should always make your own analysis and invest based on your own insights.