
In the world of growth investing, combining technical strength with fundamental momentum is a strategy employed by many successful traders. One systematic approach, popularized by Mark Minervini, uses a Trend Template to identify stocks in strong uptrends, then layers on fundamental screens to ensure the company exhibits accelerating growth in earnings, sales, and profitability. This method aims to capture leaders early in their growth cycle, leveraging both price momentum and business outperformance. A screen that blends Minervini’s technical criteria with a High Growth Momentum (HGM) rating helps isolate securities that are not only trending well but also demonstrating strong financial expansion.
ELBIT SYSTEMS LTD (NASDAQ:ESLT) emerges as a notable candidate through this lens. The Israeli-based defense technology company has shown clear alignment with the Minervini Trend Template, signaling solid technical health, while its financial metrics reflect the high-growth characteristics sought by momentum investors.
Technical Strength: Meeting the Minervini Trend Template
The Trend Template is designed to identify stocks in a confirmed Stage 2 uptrend, minimizing risk by focusing on issues with clear momentum and relative strength. ESLT satisfies these technical prerequisites convincingly:
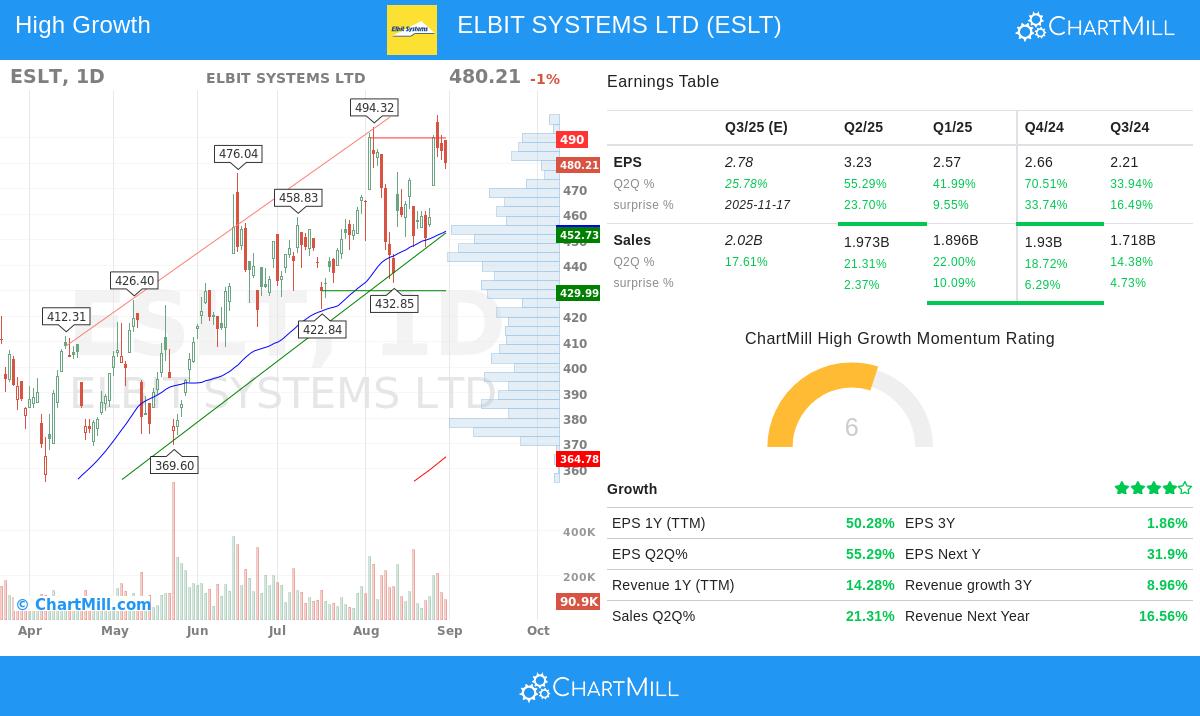
- Price Above Key Moving Averages: The current price of $480.21 trades well above the 50-day ($453.38), 150-day ($399.36), and 200-day SMA ($364.78), confirming both short-term and long-term bullish trends.
- Rising Moving Averages: The 200-day SMA has been trending upward, from a previous value of $363.53 to $364.78, indicating sustained long-term momentum. The 50-day and 150-day averages are also ascending.
- Moving Average Alignment: The 50-day SMA resides above both the 150-day and 200-day averages, a key bullish configuration that signals accelerating momentum across timeframes.
- Proximity to Highs: With a current price just 3.8% below its 52-week high of $499.00 and 155% above its 52-week low of $188.53, ESLT demonstrates strong recovery and momentum, well within the Template’s requirement that the price be within 25% of the high and at least 30% above the low.
- Superior Relative Strength: A ChartMill Relative Strength rating of 95.13 indicates that ESLT is outperforming 95% of all stocks, a critical factor in Minervini’s strategy, as market leaders typically exhibit high relative strength early in their advances.
These technical traits are not arbitrary; they are hallmarks of stocks under accumulation, often by institutional investors. They provide a framework to avoid downtrends and sideways markets, focusing capital on issues with the highest probability of continued appreciation.
Fundamental Momentum: Qualifying as a High-Growth Candidate
Beyond chart patterns, sustainable rallies are often fueled by fundamental improvement. ESLT’s financial metrics reveal a company experiencing significant growth acceleration:
- Earnings Expansion: EPS growth on a trailing twelve-month (TTM) basis stands at 50.3%, with recent quarterly growth rates exceptionally strong, 55.3% in the last quarter, 42.0% in the prior quarter, and 70.5% two quarters ago. This pattern of acceleration is exactly what growth investors target, as it often attracts further institutional interest and upward earnings revisions.
- Sales Growth and Momentum: Revenue growth is strong, with TTM sales up 14.3%. More importantly, recent quarterly sales growth has been accelerating: 21.3% last quarter, 22.0% the quarter before, and 18.7% two quarters prior. This indicates expanding market reach or product demand.
- Consistent Earnings Surprises: The company has beaten EPS estimates in each of the last four quarters, with an average beat of 18.75%. Such consistent outperformance often leads analysts to revise future estimates upward, creating a positive feedback loop.
- Improving Profitability: Profit margins have been expanding, with the last quarter showing a margin of 5.65%, up from 4.66% the previous quarter and 4.82% three quarters ago. Rising margins suggest operational efficiency and pricing power, key drivers of high-quality earnings growth.
- Strong Cash Flow Generation: Free cash flow per share has surged by 967% over the past year, reaching $12.23. This provides the company with financial flexibility to invest in growth, pay down debt, or return capital to shareholders.
These fundamental metrics align perfectly with the philosophy that “big earnings attract big attention.” Stocks showing rapid and accelerating growth in profits and sales, coupled with positive estimate revisions and expanding margins, are frequently at the forefront of market leadership.
Technical and Setup Assessment
According to ChartMill’s automated technical analysis, ESLT earns a perfect technical rating of 10/10, reflecting its strong trend, high relative strength, and performance above key moving averages. The report notes that the stock is trading near its 52-week high and outperforming the majority of stocks in the Aerospace & Defense industry. While the setup rating is currently a 6 due to recent volatility, which may require patience for an optimal entry point, the overall technical health is exceptional. Key support levels are identified between $452,453 and $423,433, providing logical areas for stop-loss placement.
For a detailed breakdown of the technical picture, readers can review the full technical analysis report for ESLT.
Conclusion
ELBIT SYSTEMS LTD represents a notable case where strong technical momentum intersects with solid fundamental growth. It meets the rigorous criteria of the Minervini Trend Template, suggesting the stock is in a confirmed uptrend with superior relative strength. Simultaneously, its accelerating earnings, sales growth, margin expansion, and consistent earnings surprises qualify it as a high-growth candidate likely to attract continued institutional interest. For investors employing a growth-and-momentum strategy, ESLT offers a balanced blend of technical confirmation and fundamental acceleration.
For those interested in exploring other stocks that fit this rigorous blend of technical and fundamental strength, more results can be found using the High Growth Momentum + Trend Template screen.
Disclaimer: This article is for informational and educational purposes only and does not constitute investment advice. The author holds no position in ESLT. Investors should conduct their own research and consider their risk tolerance before making any investment decisions.