
Our stock screener has identified EVERSOURCE ENERGY (NYSE:ES) as a potential breakout candidate. This technical breakout setup pattern occurs when the stock consolidates after a strong uptrend. While the actual breakout is uncertain, it may be worth keeping an eye on NYSE:ES.
In-Depth Technical Analysis of ES
ChartMill assigns a Technical Rating to every stock. This score ranges from 0 to 10 and is updated daily. The score is determined by evaluating multiple technical indicators and properties.
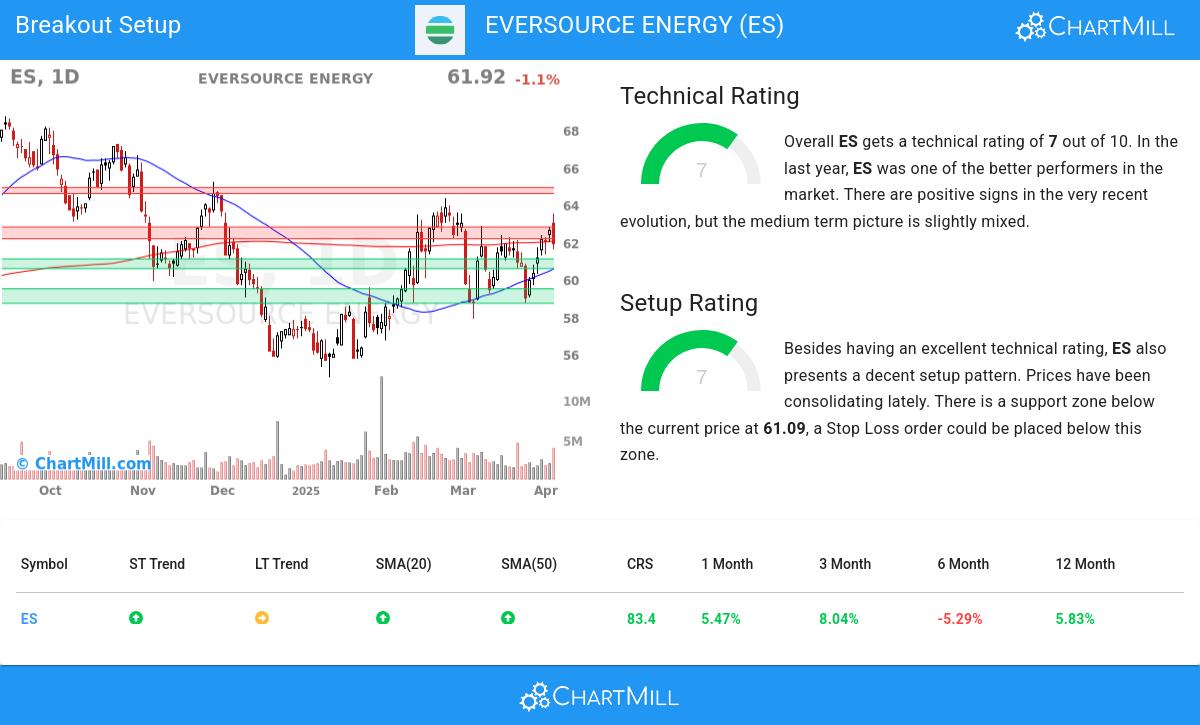
Overall ES gets a technical rating of 7 out of 10. ES has been one of the better performers in the overall market. Some doubts were observed in the medium time frame, but recent action was again very positive.
- The long term trend is still neutral, but the short term trend is positive, so the stock is getting more and more appreciated by traders and investors.
- In the last month ES has a been trading in the 58.75 - 63.50 range, which is quite wide. It is currently trading near the high of this range.
- Prices have been consolidating recently, this may present a good entry opportunity.
- When comparing the yearly performance of all stocks, we notice that ES is one of the better performing stocks in the market, outperforming 83% of all stocks. However, this overall good ranking is mostly due to the recent strong move.
- ES is part of the Electric Utilities industry. There are 46 other stocks in this industry, ES did better than 44% of them.
- ES is currently trading in the middle of its 52 week range. This is in line with the S&P500 Index, which is also trading in the middle of its range.
Our latest full technical report of ES contains the most current technical analsysis.
Looking at the Setup
ChartMill takes into account not only the Technical Rating but also assigns a Setup Rating to each stock. This rating, on a scale of 0 to 10, reflects the degree of consolidation observed based on short-term technical indicators. Currently, ES exhibits a 7 setup rating, indicating its consolidation status in recent days and weeks.
ES has an excellent technical rating and also presents a decent setup pattern. Prices have been consolidating lately. There is a support zone below the current price at 61.09, a Stop Loss order could be placed below this zone.
How to trade ES?
One way to play this would be to wait for the actual breakout to happen and buy when the stock breaks out above the current consolidation zone. A possible place for a stop loss would be below this zone.
Disclaimer: This article is not intended to provide trading advice. It is crucial to conduct your own analysis and consider your own observations and trading style when making investment decisions. The article solely presents technical observations and should not be relied upon as a sole basis for trading.
More breakout setups can be found in our Breakout screener.
Disclaimer
This is not investing advice! The article highlights some of the observations at the time of writing, but you should always make your own analysis and invest based on your own insights.