
A common challenge for investors is finding companies with strong basic business momentum before their stock prices show that possibility. One method to address this is by joining fundamental and technical analysis, looking for stocks with solid growth, profitability, and financial condition that are also near a technical breakout. This method tries to find companies where better business basics may be ready to cause a major change in market feeling and price movement. The stock discussed today, e.l.f. Beauty Inc (NYSE:ELF), came from a screen made to find exactly these kinds of situations.
Fundamental Strength: The Engine for Growth
The center of this investment method depends on finding companies with a strong basic foundation. e.l.f. Beauty’s fundamental analysis report shows a business performing well in several areas, especially in parts important for a growth stock.
- Outstanding Growth Path: The company gets a Growth Rating of 7/10. Its revenue growth has been very fast, averaging close to 36% each year over recent years. While future growth guesses are good at over 12%, they show a slowing from these outstanding past rates, a normal change for growing growth companies.
- High Profitability: With a Profitability Rating of 8/10, e.l.f. Beauty shows it can change sales into earnings well. Important margins are notable and getting better:
- Gross Margin: 70.27%, doing better than 61% of similar companies in the Personal Care Products industry.
- Operating Margin: 9.80%, better than 75% of industry rivals.
- The company has been regularly profitable with positive cash flow for the last five years.
- Sufficient Financial Condition: The company has a Health Rating of 6/10. It keeps a good current ratio of 2.70, showing acceptable short-term liquidity. While it has a medium amount of debt (Debt/Equity of 0.73), its Altman-Z score points to no short-term bankruptcy danger. This picture supports the operational growth needed for a growth stock.
The valuation, with a P/E ratio near 25, is seen as high compared to the wider market. However, for a growth stock, a high valuation can be acceptable if the company keeps delivering on its high-growth, high-profitability path, which e.l.f. Beauty has regularly done.
Technical Setup: Positioning for a Possible Breakout
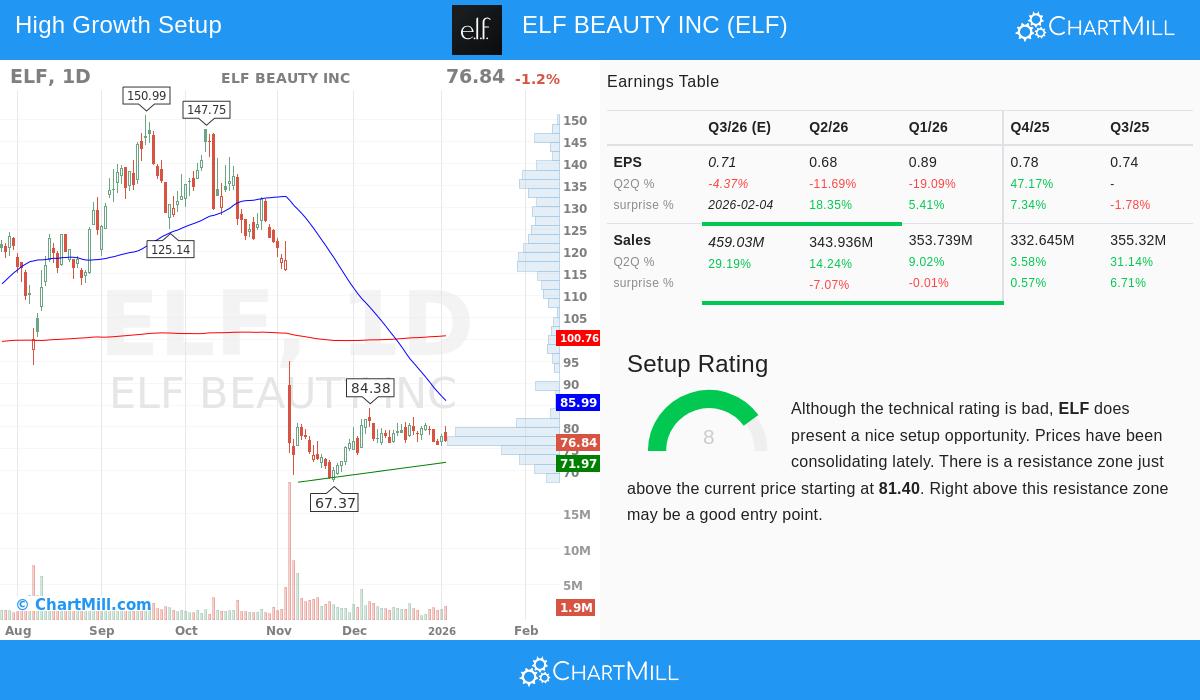
While fundamentals give the "why," technical analysis helps find the "when." e.l.f. Beauty’s technical analysis report presents an interesting, though detailed, picture. The stock gets a low overall technical rating because of its large underperformance over the past year, trading much below its 52-week high. However, it gets a high Setup Rating of 8/10, pointing out a specific consolidation pattern that often comes before a new directional move.
The stock has been trading in a set range between about $75.73 and $84.38 over the last month, forming a base after a long downtrend. This consolidation is a key part watched by technical analysts, as it can show a time of balance where selling pressure is taken in before a possible rise.
- Key Resistance: A clear resistance zone exists between $81.40 and $81.62, made by a mix of trendlines.
- Short-Term Support: Support is found near the $72-$74 level from trendlines and horizontal price movement.
The setup indicates that a clear break above the $81.40-$81.62 resistance zone on high volume could show a change in momentum, possibly clearing the way for a move higher. This technical arrangement is what the screening method aims for: a basically strong stock that is technically resetting itself after a drop.
Connecting the Method to the Stock
This joined analysis is key to the method. A strong growth picture makes sure the company has the earnings and sales momentum to possibly support investor interest and higher prices. Good profitability and health numbers show the growth is lasting and not powered by too much financial risk. The technical breakout pattern finds a possible entry point where the stock's price movement shows signs of matching its positive basics, giving a tactical moment for investors who have been waiting for the downward momentum to stop.
While the long-term trend is still negative, the current consolidation at a lower price level, together with the company's unchanged business strength, makes a situation where the stock may be changing from a time of price fall to one of stabilization and possible rebound.
Looking for Similar Possibilities
The method that found e.l.f. Beauty as a candidate with good growth basics and a hopeful technical setup can be used to find other possible chances in the market. Investors interested in using this joined analysis method can run this screen themselves to see the current results.
Disclaimer: This article is for information only and does not make up investment advice, a suggestion, or an offer to buy or sell any security. The analysis is based on data and reports given by ChartMill, and investors should do their own research and talk with a qualified financial advisor before making any investment choices. Past performance is not a guide for future results.