
In the world of growth investing, combining a solid technical framework with firm fundamental momentum can be an effective method for spotting possible leaders. One strategy that shows this is the system made popular by trader Mark Minervini. His method, called the Specific Entry Point Analysis (SEPA), joins a strict technical checklist, the Trend Template, with a concentration on companies showing speeding earnings and sales growth. The aim is to locate stocks already in strong uptrends, supported by fundamental gains that can drive more price increases. This two-part method tries to seize stocks during the early to middle parts of a major rise, where the chance of large returns is greater while risk is controlled through exact entry and exit rules.
ENERFLEX LTD (NYSE:EFXT) recently appeared through a screening process made to locate such chances. The screen used Minervini's Trend Template to sort for technically sound charts and matched it with a High Growth Momentum (HGM) rating to confirm basic fundamental strength. This pairing tries to separate companies that are not only trending positively but also have the financial capacity to maintain their momentum.
Technical Strength: Matching the Trend Template
A central idea of the Minervini strategy is to invest in the direction of a set trend, steering clear of the problems of trying to buy a declining stock. The Trend Template gives a structured way to spot stocks in a confirmed Stage 2 uptrend. EFXT's present chart shows a strong match with these technical points:
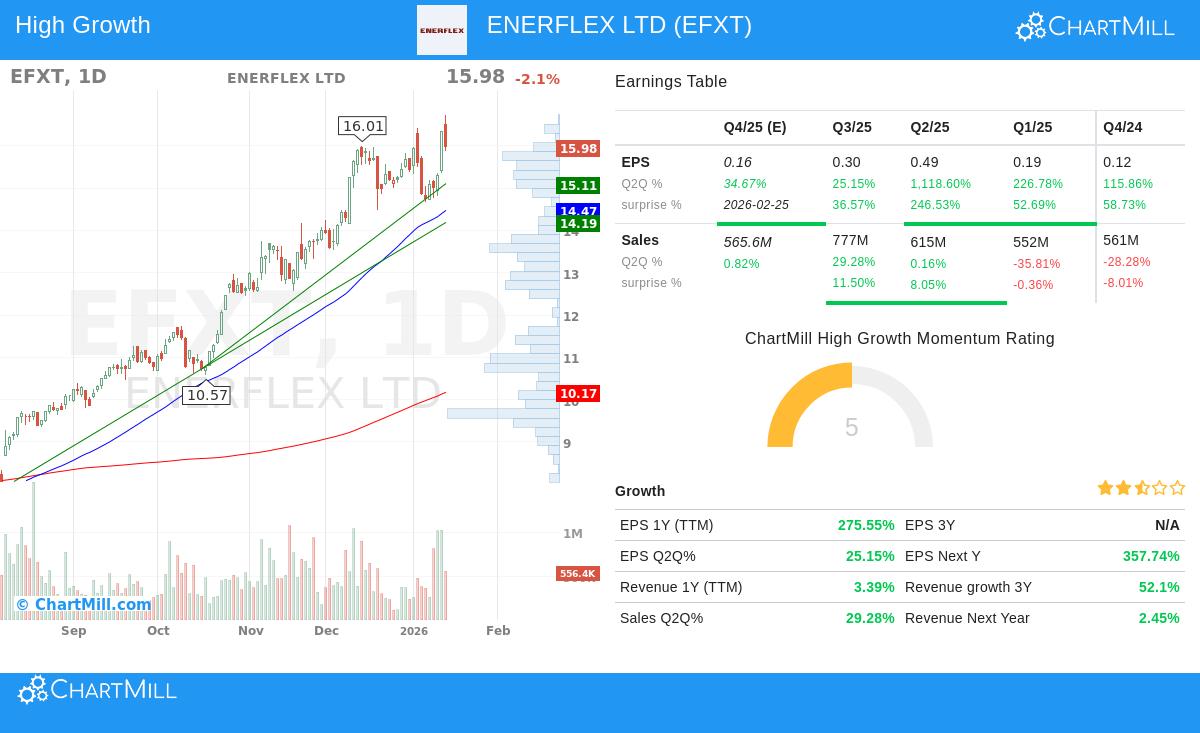
- Trending Above Key Averages: The stock's price is trading notably above its rising 50-day ($14.47), 150-day ($11.24), and 200-day ($10.17) simple moving averages (SMAs). This ordered alignment, with the shorter-term averages above the longer-term ones, is a standard sign of a sound, speeding uptrend.
- Nearness to Highs: EFXT is presently within 5% of its 52-week high of $16.73, having risen over 158% from its 52-week low of $6.18. Minervini states that real market leaders often reach new highs, and buying stocks close to their highs, instead of looking for large discounts, can lead to joining the strongest moves.
- Better Relative Strength: With a ChartMill Relative Strength (CRS) score of 92.63, EFXT is doing better than over 92% of the wider market. High relative strength is a required filter in the strategy, as it spots sector leaders and stocks being bought by institutional investors.
This technical view indicates EFXT is in a clear, long-term positive phase. The good long-term and short-term trends mentioned in the technical report, along with recent increase in trading volume, point to continued buying interest.
Fundamental Momentum: The Driver for Growth
While a strong chart puts a stock on the watchlist, fundamental speeding up is what Minervini names the "fuel" for a maintained rise. The High Growth Momentum part of the screen centers on this fuel, and EFXT shows several important traits:
- Large Earnings Growth: The company's trailing twelve-month (TTM) EPS has increased by a very large 275.6% year-over-year. Even more notable is the trend in recent quarters, with EPS growth rates of 115.9%, 226.8%, and 1118.6% in the prior three quarters, respectively, ending with a 25.1% growth in the most recent quarter. This pattern of major, sequential growth is a key sign looked for by momentum investors.
- Steady Earnings Surprises: EFXT has exceeded analyst EPS estimates in all of the last four quarters, with an average surprise of nearly 99%. This steady overperformance can lead to positive estimate changes and greater investor trust.
- Gaining Profitability: After a time of strain, the company's profit margins have shown clear gain. The most recent quarterly profit margin of 4.8% shows a major recovery and an upward trend from earlier quarters, signaling better operational efficiency and pricing ability.
- Positive Estimate Changes: Analysts have been increasing their forecasts, with the average estimate for next year's EPS moved up by 1.3% over the last three months. Upward changes often come before more price gains as the market includes better future expectations.
These fundamental measures are vital because, as Minervini states, "big earnings draw big attention." A stock with a strong technical breakout is much more likely to see a maintained rally if it is backed by strong and speeding fundamental growth, which draws the large-scale institutional buying that pushes major price moves.
Technical Condition and Setup Evaluation
ChartMill's own analysis gives a brief summary of EFXT's technical position. The stock receives a perfect Technical Rating of 10 out of 10, showing very good condition across several timeframes and measures. It is reaching new 52-week highs and shows firm relative strength within its Energy Equipment & Services industry, doing better than 86% of its peers.
However, the report notes a Setup Rating of 5, meaning that while the long-term trend is very good, the immediate setup is not perfect for a new entry. The stock has been trading in a wide range over the past month and has increased firmly lately. The analysis proposes that while the technical base is solid, the quality of the present setup is only medium, and a time of consolidation or a move back toward support levels (noted near $15.00 and $14.74) might give a more favorable risk/reward entry point for traders following strict SEPA rules. A full list of the support and resistance levels, with detailed notes, is found in the detailed technical report.
Conclusion
ENERFLEX LTD shows a case where a strict, rules-based screening process spots a stock that matches both the technical rules of the Minervini Trend Template and the fundamental push needed for high-growth momentum investing. Its strong price trend, leader-level relative strength, and large, speeding earnings growth form a combination of factors that growth-focused investors often look for. The technical analysis confirms the strength of the trend while carefully noting that the present momentum may call for waiting for a more clear setup. For investors using a growth-and-momentum structure, EFXT stands as a candidate worth more examination and watching for possible entry chances that fit their specific risk control rules.
For those wanting to look at other stocks that meet this mix of technical and fundamental points, the screening settings used can be found and changed via this High Growth Momentum + Trend Template screen.
Disclaimer: This article is for information and learning only. It is not meant as investment advice, nor does it form a suggestion to buy, sell, or hold any security. The analysis is based on given data and described screening methods, which have built-in limits. Investors should do their own full research and think about their personal financial position and risk tolerance before making any investment choices.