
Our stock screener has spotted NEW ORIENTAL EDUCATIO-SP ADR (NYSE:EDU) as a growth stock which is not overvalued. EDU is scoring great on several growth aspects while it also shows decent health and profitability. At the same time it remains remains attractively priced. We'll dive into each aspect below.
A Closer Look at Growth for EDU
Every stock receives a Growth Rating from ChartMill, ranging from 0 to 10. This rating assesses various growth aspects, including historical and projected EPS and revenue growth. EDU boasts a 7 out of 10:
- The Earnings Per Share has grown by an impressive 44.32% over the past year.
- EDU shows a strong growth in Revenue. In the last year, the Revenue has grown by 34.42%.
- The Earnings Per Share is expected to grow by 27.60% on average over the next years. This is a very strong growth
- Based on estimates for the next years, EDU will show a quite strong growth in Revenue. The Revenue will grow by 11.28% on average per year.
- The EPS growth rate is accelerating: in the next years the growth will be better than in the last years.
- When comparing the Revenue growth rate of the last years to the growth rate of the upcoming years, we see that the growth is accelerating.
Looking at the Valuation
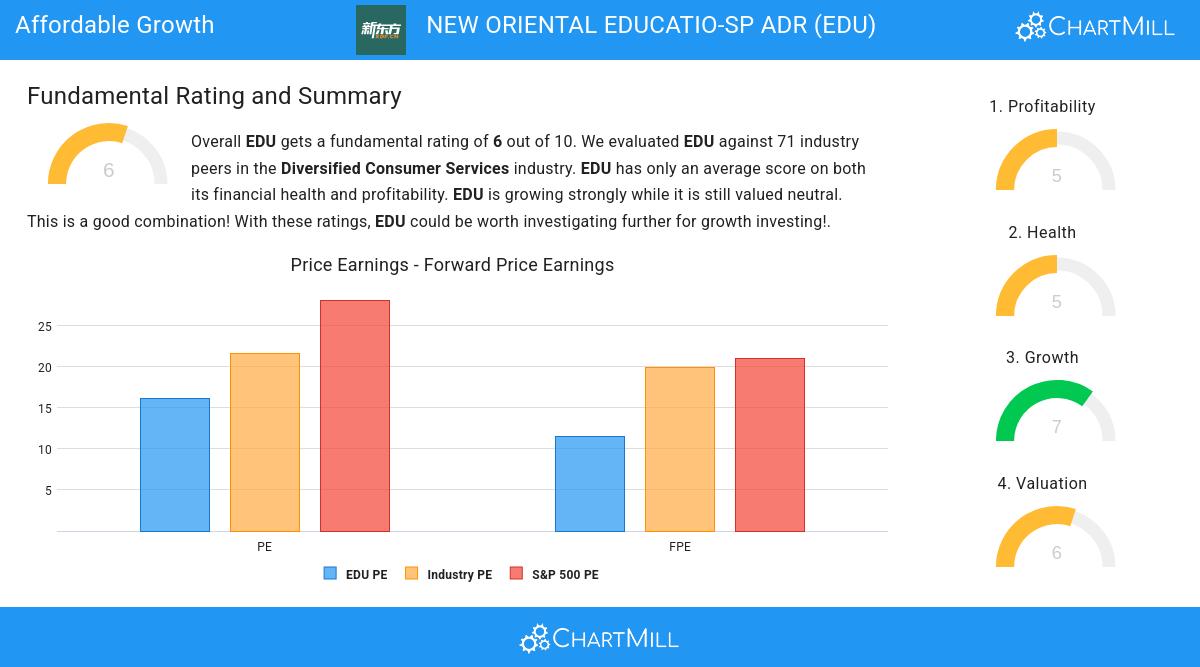
ChartMill assigns a proprietary Valuation Rating to each stock. The score is computed by evaluating various valuation aspects, like price to earnings and free cash flow, both absolutely as relative to the market and industry. EDU was assigned a score of 6 for valuation:
- Based on the Price/Earnings ratio, EDU is valued a bit cheaper than 73.24% of the companies in the same industry.
- EDU is valuated rather cheaply when we compare the Price/Earnings ratio to 28.15, which is the current average of the S&P500 Index.
- A Price/Forward Earnings ratio of 11.47 indicates a reasonable valuation of EDU.
- Based on the Price/Forward Earnings ratio, EDU is valued cheaply inside the industry as 87.32% of the companies are valued more expensively.
- Compared to an average S&P500 Price/Forward Earnings ratio of 21.09, EDU is valued a bit cheaper.
- Based on the Price/Free Cash Flow ratio, EDU is valued cheaply inside the industry as 92.96% of the companies are valued more expensively.
- EDU's low PEG Ratio(NY), which compensates the Price/Earnings for growth, indicates a rather cheap valuation of the company.
- A more expensive valuation may be justified as EDU's earnings are expected to grow with 27.60% in the coming years.
Exploring EDU's Health
A critical element of ChartMill's stock evaluation is the Health Rating, which spans from 0 to 10. This rating considers multiple health factors, including liquidity and solvency, both in absolute terms and relative to industry peers. EDU has received a 5 out of 10:
- The Debt to FCF ratio of EDU is 0.01, which is an excellent value as it means it would take EDU, only 0.01 years of fcf income to pay off all of its debts.
- EDU has a Debt to FCF ratio of 0.01. This is amongst the best in the industry. EDU outperforms 88.73% of its industry peers.
- EDU has a Debt/Equity ratio of 0.00. This is a healthy value indicating a solid balance between debt and equity.
- EDU's Debt to Equity ratio of 0.00 is fine compared to the rest of the industry. EDU outperforms 77.46% of its industry peers.
- With a decent Current ratio value of 1.71, EDU is doing good in the industry, outperforming 67.61% of the companies in the same industry.
- EDU has a Quick ratio of 1.68. This is in the better half of the industry: EDU outperforms 70.42% of its industry peers.
Looking at the Profitability
ChartMill's Profitability Rating offers a unique perspective on stock analysis, providing scores from 0 to 10. These ratings consider a wide range of profitability metrics and margins, both in comparison to industry peers and on their own merits. For EDU, the assigned 5 is a significant indicator of profitability:
- Looking at the Return On Assets, with a value of 5.13%, EDU is in the better half of the industry, outperforming 74.65% of the companies in the same industry.
- With a decent Return On Equity value of 10.58%, EDU is doing good in the industry, outperforming 67.61% of the companies in the same industry.
- The Return On Invested Capital of EDU (7.58%) is better than 78.87% of its industry peers.
- EDU has a better Profit Margin (8.13%) than 70.42% of its industry peers.
- EDU has a Operating Margin of 9.06%. This is in the better half of the industry: EDU outperforms 69.01% of its industry peers.
- EDU has a Gross Margin of 52.91%. This is in the better half of the industry: EDU outperforms 67.61% of its industry peers.
Every day, new Affordable Growth stocks can be found on ChartMill in our Affordable Growth screener.
Check the latest full fundamental report of EDU for a complete fundamental analysis.
Disclaimer
This is not investing advice! The article highlights some of the observations at the time of writing, but you should always make your own analysis and invest based on your own insights.