
Our stock screener has spotted NEW ORIENTAL EDUCATIO-SP ADR (NYSE:EDU) as a growth stock which is not overvalued. EDU is scoring great on several growth aspects while it also shows decent health and profitability. At the same time it remains remains attractively priced. We'll dive into each aspect below.
Understanding EDU's Growth
ChartMill employs its own Growth Rating system for all stocks. This score, ranging from 0 to 10, is derived by evaluating different growth factors, such as EPS and revenue growth, taking into account both past performance and future projections. EDU has earned a 7 for growth:
- The Earnings Per Share has grown by an impressive 44.32% over the past year.
- EDU shows a strong growth in Revenue. In the last year, the Revenue has grown by 34.42%.
- Based on estimates for the next years, EDU will show a very strong growth in Earnings Per Share. The EPS will grow by 27.73% on average per year.
- The Revenue is expected to grow by 11.28% on average over the next years. This is quite good.
- The EPS growth rate is accelerating: in the next years the growth will be better than in the last years.
- When comparing the Revenue growth rate of the last years to the growth rate of the upcoming years, we see that the growth is accelerating.
How do we evaluate the Valuation for EDU?
ChartMill provides a Valuation Rating to every stock, ranging from 0 to 10. This rating assesses various valuation aspects, comparing price to earnings and cash flows, while considering factors like profitability and growth. EDU boasts a 7 out of 10:
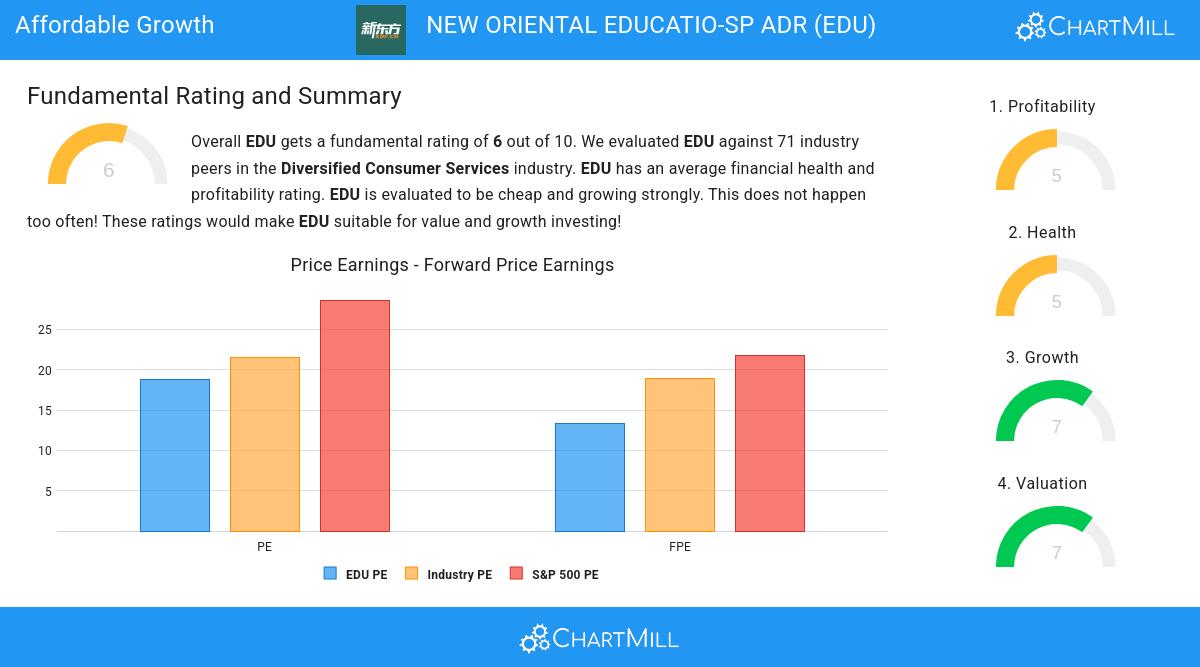
- Based on the Price/Earnings ratio, EDU is valued a bit cheaper than 67.61% of the companies in the same industry.
- When comparing the Price/Earnings ratio of EDU to the average of the S&P500 Index (28.63), we can say EDU is valued slightly cheaper.
- EDU's Price/Forward Earnings ratio is rather cheap when compared to the industry. EDU is cheaper than 80.28% of the companies in the same industry.
- EDU is valuated rather cheaply when we compare the Price/Forward Earnings ratio to 21.72, which is the current average of the S&P500 Index.
- Based on the Enterprise Value to EBITDA ratio, EDU is valued cheaply inside the industry as 97.18% of the companies are valued more expensively.
- Based on the Price/Free Cash Flow ratio, EDU is valued cheaper than 94.37% of the companies in the same industry.
- EDU's low PEG Ratio(NY), which compensates the Price/Earnings for growth, indicates a rather cheap valuation of the company.
- EDU's earnings are expected to grow with 27.73% in the coming years. This may justify a more expensive valuation.
Health Insights: EDU
ChartMill employs a unique Health Rating system for all stocks. This rating, ranging from 0 to 10, is determined by analyzing various liquidity and solvency ratios. For EDU, the assigned 5 for health provides valuable insights:
- The Debt to FCF ratio of EDU is 0.01, which is an excellent value as it means it would take EDU, only 0.01 years of fcf income to pay off all of its debts.
- EDU has a Debt to FCF ratio of 0.01. This is amongst the best in the industry. EDU outperforms 88.73% of its industry peers.
- EDU has a Debt/Equity ratio of 0.00. This is a healthy value indicating a solid balance between debt and equity.
- EDU has a Debt to Equity ratio of 0.00. This is in the better half of the industry: EDU outperforms 76.06% of its industry peers.
- EDU has a Current ratio of 1.71. This is in the better half of the industry: EDU outperforms 67.61% of its industry peers.
- EDU has a Quick ratio of 1.68. This is in the better half of the industry: EDU outperforms 70.42% of its industry peers.
Profitability Assessment of EDU
ChartMill employs its own Profitability Rating system for stock evaluation. This score, ranging from 0 to 10, is derived from an analysis of diverse profitability metrics and margins. In the case of EDU, the assigned 5 is noteworthy for profitability:
- With a decent Return On Assets value of 5.13%, EDU is doing good in the industry, outperforming 74.65% of the companies in the same industry.
- EDU has a better Return On Equity (10.58%) than 66.20% of its industry peers.
- The Return On Invested Capital of EDU (7.58%) is better than 78.87% of its industry peers.
- EDU's Profit Margin of 8.13% is fine compared to the rest of the industry. EDU outperforms 70.42% of its industry peers.
- The Operating Margin of EDU (9.06%) is better than 69.01% of its industry peers.
- EDU's Gross Margin of 52.91% is fine compared to the rest of the industry. EDU outperforms 67.61% of its industry peers.
Our Affordable Growth screener lists more Affordable Growth stocks and is updated daily.
Our latest full fundamental report of EDU contains the most current fundamental analsysis.
Disclaimer
This article should in no way be interpreted as advice. The article is based on the observed metrics at the time of writing, but you should always make your own analysis and trade or invest at your own responsibility.