
We've identified ELECTRONIC ARTS INC (NASDAQ:EA) as a potential breakout candidate based on our stock screener's analysis. This breakout setup pattern suggests that after a strong uptrend, the stock is currently consolidating, potentially signaling a continuation of the trend. Keep an eye on NASDAQ:EA for further developments.
Technical analysis of EA
Every day, ChartMill assigns a Technical Rating to each stock, providing a score ranging from 0 to 10. This rating is determined by evaluating various technical indicators and properties.
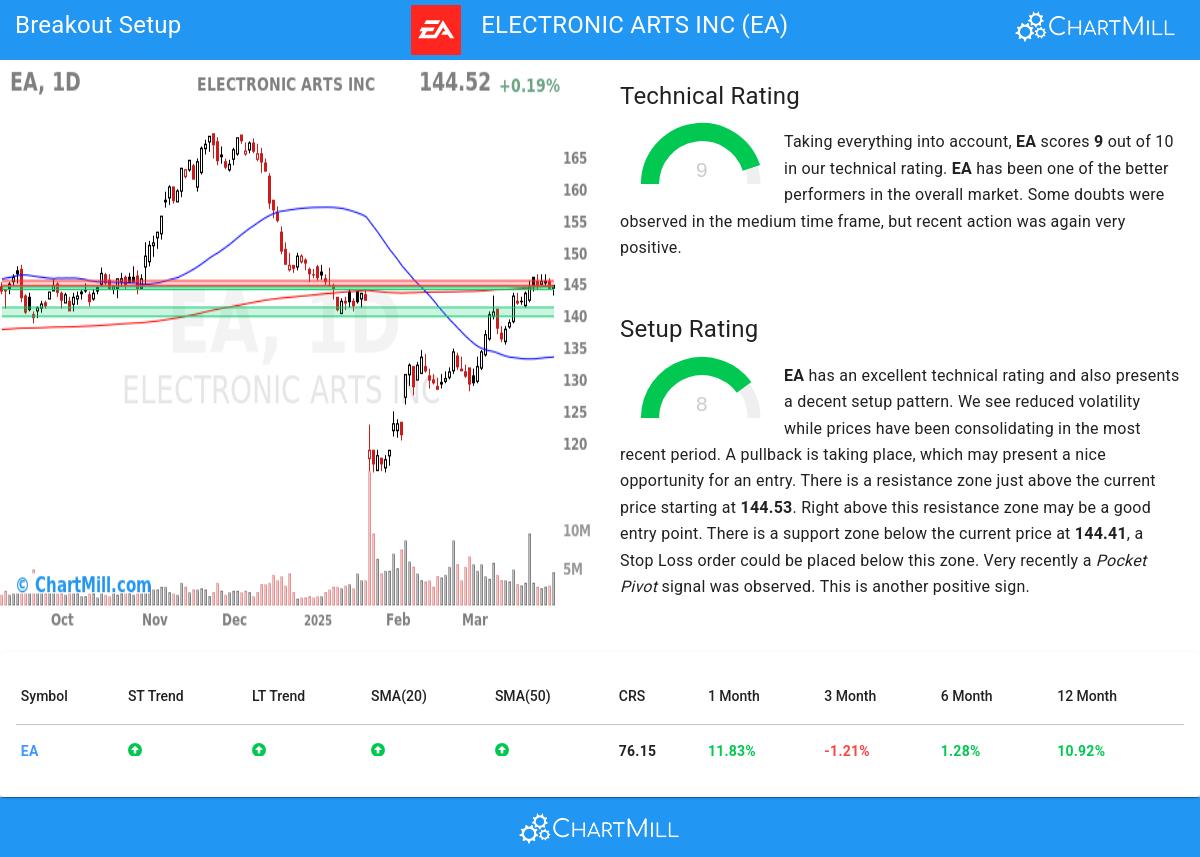
Overall EA gets a technical rating of 9 out of 10. EA has been one of the better performers in the overall market. Some doubts were observed in the medium time frame, but recent action was again very positive.
- Both the short term and long term trends are positive. This is a very positive sign.
- Looking at the yearly performance, EA did better than 76% of all other stocks. On top of that, EA also shows a nice and consistent pattern of rising prices.
- EA is one of the better performing stocks in the Entertainment industry, it outperforms 73% of 73 stocks in the same industry.
- In the last month EA has a been trading in the 129.24 - 146.45 range, which is quite wide. It is currently trading near the high of this range.
- EA is currently trading in the middle of its 52 week range. This is in line with the S&P500 Index, which is also trading in the middle of its range.
For an up to date full technical analysis you can check the technical report of EA
How do we evaluate the setup for EA?
Alongside the Technical Rating, ChartMill assigns a Setup Rating to evaluate the consolidation level of a stock. This rating, ranging from 0 to 10, is updated daily and considers various short-term technical indicators. The current setup rating for EA is 8:
Besides having an excellent technical rating, EA also presents a decent setup pattern. Prices have been consolidating lately and the volatility has been reduced. A pullback is taking place, which may present a nice opportunity for an entry. There is a resistance zone just above the current price starting at 144.53. Right above this resistance zone may be a good entry point. There is a support zone below the current price at 144.41, a Stop Loss order could be placed below this zone. Very recently a Pocket Pivot signal was observed. This is another positive sign.
How to trade EA?
One strategy to consider is waiting for the actual breakout to occur, where the stock breaks out above the current consolidation zone. Traders can then enter a buy position, anticipating further upward momentum. As a risk management measure, it is advisable to set a stop loss order below the consolidation zone.
Disclaimer: This article is not intended to provide trading advice. It is crucial to conduct your own analysis and consider your own observations and trading style when making investment decisions. The article solely presents technical observations and should not be relied upon as a sole basis for trading.
Every day, new breakout setups can be found on ChartMill in our Breakout screener.
Keep in mind
Important Note: The content of this article is not intended as trading advice. It is essential to perform your own analysis and exercise caution when making trading decisions. The article presents observations created by automated analysis but does not guarantee any trading or investment outcomes. Always trade responsibly and make independent judgments.