
DexCom Inc (NASDAQ:DXCM) has become a strong option for investors looking for growth stocks with positive technical breakout patterns. The selection process uses both fundamental and technical analysis, targeting companies with solid growth, good profitability, and strong financials, while also identifying stocks ready for upward movement. This combined strategy helps find high-potential stocks before major price increases, using growth metrics alongside technical signals that point to possible breakouts.
Why DexCom Meets the Growth Criteria
DexCom, a top player in continuous glucose monitoring (CGM) systems, shows several traits that match growth investing principles:
- Consistent Revenue and Earnings Growth: Over the last five years, DexCom has achieved a notable 22.27% annual revenue growth, with analysts predicting a 14.01% rise in future revenue. Earnings per share (EPS) have grown at 29.25% yearly historically, with forward EPS expected to increase by 22.56%. These numbers put DexCom ahead of industry averages, supporting its growth path.
- Strong Profitability: The company has a Profit Margin of 12.90% and an Operating Margin of 16.54%, beating 90.91% and 87.17% of its competitors, respectively. Its Return on Equity (23.61%) and Return on Invested Capital (14.54%) also show effective use of capital.
- Fair Valuation Compared to Growth: While DexCom’s P/E ratio of 52.38 seems high, it is lower than many peers. The Forward P/E of 33.40 is more reasonable given its earnings growth outlook.
These fundamentals are key for growth investors, as they show a company’s ability to keep growing while staying efficient. For more details on DexCom’s financial health, see the full fundamental analysis report.
Technical Breakout Signals
From a technical view, DexCom displays several positive signs:
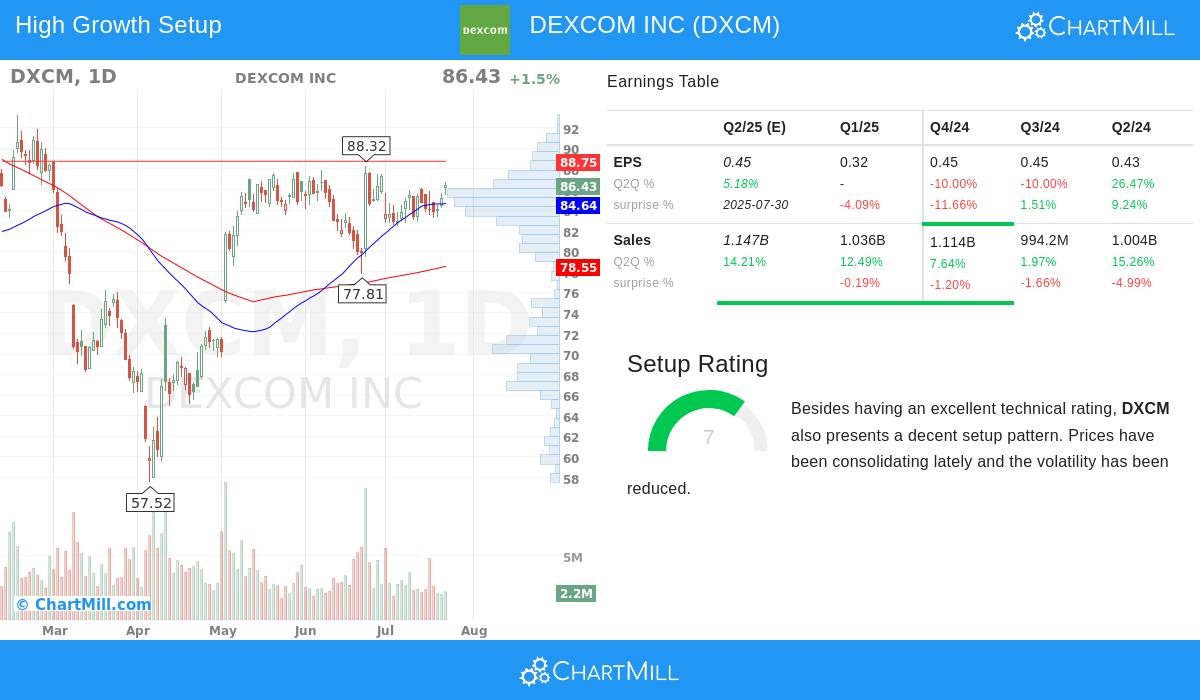
- Upward Trend Momentum: Both short-term and long-term trends are rising, with the stock above key moving averages (50-day and 200-day SMAs).
- Trading Near Resistance: The stock has stayed between $82.50 and $87.75 recently, with a key resistance area at $88.75,$89.07. A move above this level could suggest more gains.
- High Relative Strength: DexCom has done better than 84% of all stocks and 86% of its industry peers over the past year, showing steady investor confidence.
The technical analysis report suggests a possible entry point at $89.08, just above resistance, with a stop-loss at $84.57 to limit risk.
Why This Mix Is Important
Growth stocks with strong technical patterns offer a clear edge:
- Fundamental Health confirms the company can meet growth expectations.
- Technical Breakouts show market sentiment turning positive, lowering the chance of early entry.
DexCom’s role in the growing diabetes care market, a sector with long-term potential due to increasing global diabetes rates, adds to its growth story.
Find More Growth Stocks with Strong Patterns
For investors seeking similar opportunities, check the Strong Growth Stocks with Good Technical Setup Ratings screener to find other high-potential stocks.
Disclaimer: This analysis is for informational purposes only and does not constitute investment advice. Always conduct your own research or consult a financial advisor before making investment decisions.