
DEXCOM INC (NASDAQ:DXCM) has been identified as a potential technical breakout candidate by our stock screener. The stock shows a combination of solid technical strength and a high-quality setup pattern, making it an interesting opportunity for traders. Below, we examine why DXCM stands out.
Technical Strength
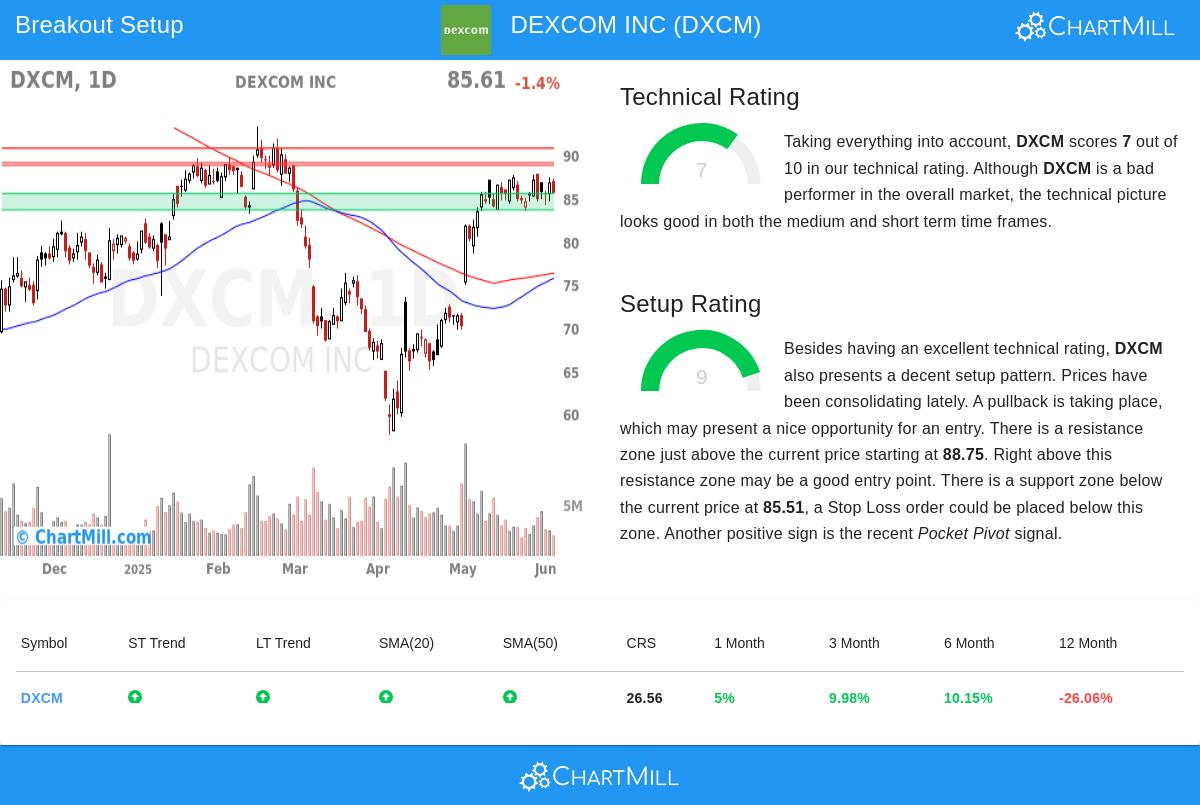
- Trend Performance: DXCM has a Technical Rating of 7, indicating a positive trend in both short and long-term timeframes. The stock is trading above key moving averages (20-day, 50-day, 100-day, and 200-day), reinforcing its upward momentum.
- Relative Strength: While DXCM has underperformed compared to 74% of stocks over the past year, recent price action suggests renewed strength, with gains of 5% over the past month and nearly 10% over the past three months.
- Volume Support: The stock has an average daily volume of 4.2 million shares, providing sufficient liquidity for traders.
Setup Quality
- Consolidation Pattern: With a Setup Rating of 9, DXCM is forming a bullish consolidation pattern. Prices have been pulling back slightly after a recent rise, creating a potential entry point.
- Support and Resistance: A clear support zone exists between $83.59 and $85.51, while resistance is found near $88.75 to $89.07. A breakout above this resistance could signal further upside.
- Pocket Pivot Signal: A recent pocket pivot—a bullish volume-driven pattern—adds further confirmation of potential upward movement.
Trade Setup Suggestion
- Entry: A breakout above $89.08 (just above resistance) could serve as a trigger for entry.
- Stop Loss: Placing a stop below the support zone at $83.58 limits downside risk to about 6.2%.
- Risk Management: Allocating 16.2% of capital to this trade would keep portfolio risk at 1%.
For more details, review the full technical analysis report for DXCM.
Our Technical Breakout Setups screener lists more breakout candidates and is updated daily.
Disclaimer
This is not investment advice. The observations here are based on technical analysis at the time of writing. Always conduct your own research before making trading decisions.