
Discover DOUBLEVERIFY HOLDINGS INC (NYSE:DV), an undervalued growth gem identified by our stock screener. NYSE:DV is shining in terms of growth metrics, and it's also displaying strong financial health and profitability. What's more, it retains an appealing valuation. We'll break it down further.
Growth Insights: NYSE:DV
ChartMill assigns a Growth Rating to every stock. This score ranges from 0 to 10 and evaluates the different growth aspects like EPS and Revenue, both in the past as in the future. NYSE:DV scores a 8 out of 10:
- DV shows a strong growth in Earnings Per Share. In the last year, the EPS has been growing by 15.62%, which is quite good.
- DV shows a strong growth in Earnings Per Share. Measured over the last years, the EPS has been growing by 83.14% yearly.
- The Revenue has grown by 19.58% in the past year. This is quite good.
- The Revenue has been growing by 40.57% on average over the past years. This is a very strong growth!
- The Earnings Per Share is expected to grow by 34.16% on average over the next years. This is a very strong growth
- Based on estimates for the next years, DV will show a quite strong growth in Revenue. The Revenue will grow by 14.23% on average per year.
Valuation Analysis for NYSE:DV
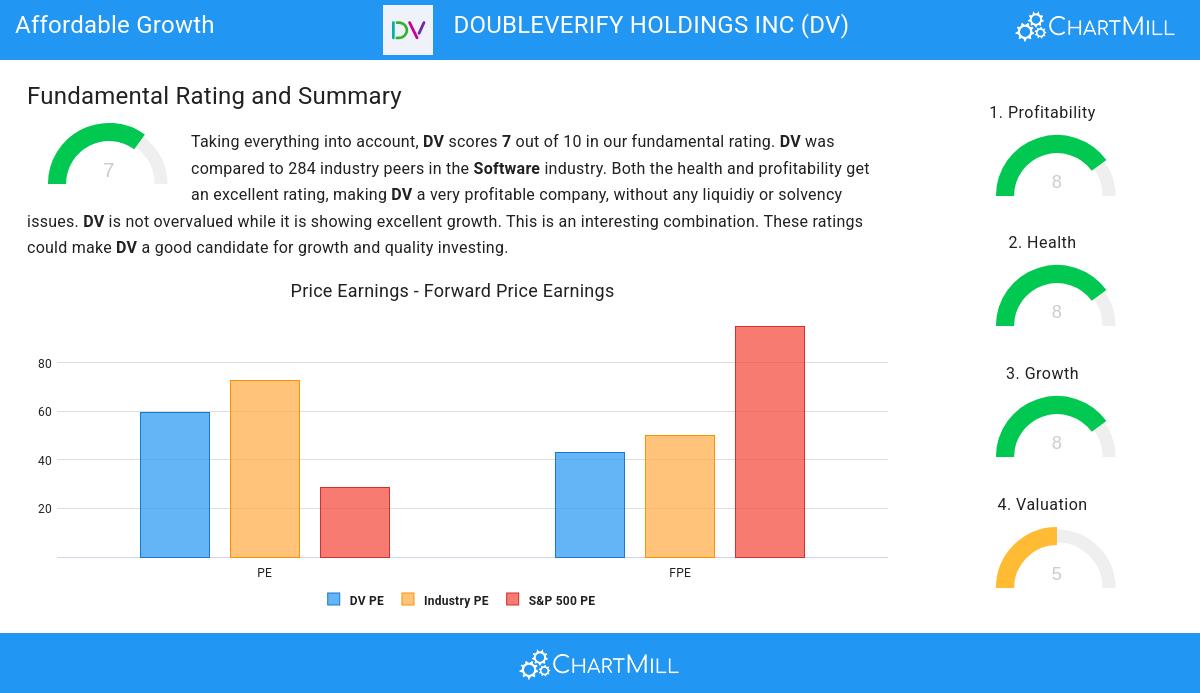
ChartMill assigns a Valuation Rating to each stock, ranging from 0 to 10. This rating is calculated by analyzing different valuation elements, such as price to earnings and free cash flow, both in absolute terms and relative to the market and industry. In the case of NYSE:DV, the assigned 5 reflects its valuation:
- DV's Price/Forward Earnings ratio is a bit cheaper when compared to the industry. DV is cheaper than 61.73% of the companies in the same industry.
- Compared to an average S&P500 Price/Forward Earnings ratio of 95.03, DV is valued rather cheaply.
- 77.98% of the companies in the same industry are more expensive than DV, based on the Enterprise Value to EBITDA ratio.
- DV's Price/Free Cash Flow ratio is rather cheap when compared to the industry. DV is cheaper than 81.95% of the companies in the same industry.
- The excellent profitability rating of DV may justify a higher PE ratio.
Assessing Health Metrics for NYSE:DV
ChartMill assigns a Health Rating to every stock. This score ranges from 0 to 10 and evaluates the different health aspects like liquidity and solvency, both absolutely, but also relative to the industry peers. NYSE:DV scores a 8 out of 10:
- DV has an Altman-Z score of 13.71. This indicates that DV is financially healthy and has little risk of bankruptcy at the moment.
- DV has a better Altman-Z score (13.71) than 88.45% of its industry peers.
- DV has a debt to FCF ratio of 0.03. This is a very positive value and a sign of high solvency as it would only need 0.03 years to pay back of all of its debts.
- With an excellent Debt to FCF ratio value of 0.03, DV belongs to the best of the industry, outperforming 80.51% of the companies in the same industry.
- DV has a Debt/Equity ratio of 0.00. This is a healthy value indicating a solid balance between debt and equity.
- With a decent Debt to Equity ratio value of 0.00, DV is doing good in the industry, outperforming 67.15% of the companies in the same industry.
- A Current Ratio of 6.57 indicates that DV has no problem at all paying its short term obligations.
- Looking at the Current ratio, with a value of 6.57, DV belongs to the top of the industry, outperforming 92.06% of the companies in the same industry.
- A Quick Ratio of 6.57 indicates that DV has no problem at all paying its short term obligations.
- DV's Quick ratio of 6.57 is amongst the best of the industry. DV outperforms 92.06% of its industry peers.
Assessing Profitability for NYSE:DV
ChartMill's Profitability Rating offers a unique perspective on stock analysis, providing scores from 0 to 10. These ratings consider a wide range of profitability metrics and margins, both in comparison to industry peers and on their own merits. For NYSE:DV, the assigned 8 is a significant indicator of profitability:
- DV has a better Return On Assets (5.02%) than 76.17% of its industry peers.
- Looking at the Return On Equity, with a value of 5.83%, DV is in the better half of the industry, outperforming 73.29% of the companies in the same industry.
- With a decent Return On Invested Capital value of 4.90%, DV is doing good in the industry, outperforming 74.37% of the companies in the same industry.
- The 3 year average ROIC (4.10%) for DV is below the current ROIC(4.90%), indicating increased profibility in the last year.
- The Profit Margin of DV (10.33%) is better than 76.90% of its industry peers.
- In the last couple of years the Profit Margin of DV has grown nicely.
- Looking at the Operating Margin, with a value of 12.74%, DV belongs to the top of the industry, outperforming 81.59% of the companies in the same industry.
- DV's Operating Margin has improved in the last couple of years.
- The Gross Margin of DV (82.42%) is better than 87.36% of its industry peers.
Our Affordable Growth screener lists more Affordable Growth stocks and is updated daily.
For an up to date full fundamental analysis you can check the fundamental report of DV
Keep in mind
Important Note: The content of this article is not intended as trading advice. It is essential to perform your own analysis and exercise caution when making trading decisions. The article presents observations created by automated analysis but does not guarantee any trading or investment outcomes. Always trade responsibly and make independent judgments.