
Investors looking to find high-potential stocks frequently use systematic methods that mix strict technical and fundamental study. One well-known method is the Mark Minervini strategy, which uses a defined Trend Template to find equities in established, strong uptrends. This structure requires exact arrangement of moving averages, closeness to 52-week highs, and better relative strength. To better focus the search for strong growth candidates, this technical screen can be paired with attention on fundamental momentum, looking for companies showing speeding earnings and sales growth. This paired method tries to separate securities that are not only technically set for progress but are also supported by solid core business performance.
Duos Technologies Group Inc (NASDAQ:DUOT) appears as a stock that currently meets this two-part screening process. The Jacksonville-based company, which supplies intelligent vision-based technology solutions for rail, logistics, and government areas, seems to show the traits that both trend-following and growth-focused investors watch carefully.
Checking the Trend Template Fit
The center of Minervini's strategy is the Trend Template, a group of fixed technical conditions made to guarantee a stock is in a controlling Stage 2 uptrend. Following these rules helps sidestep weak or basing stocks, focusing money on market leaders. A look at DUOT's chart and main metrics shows a strong fit with these conditions:
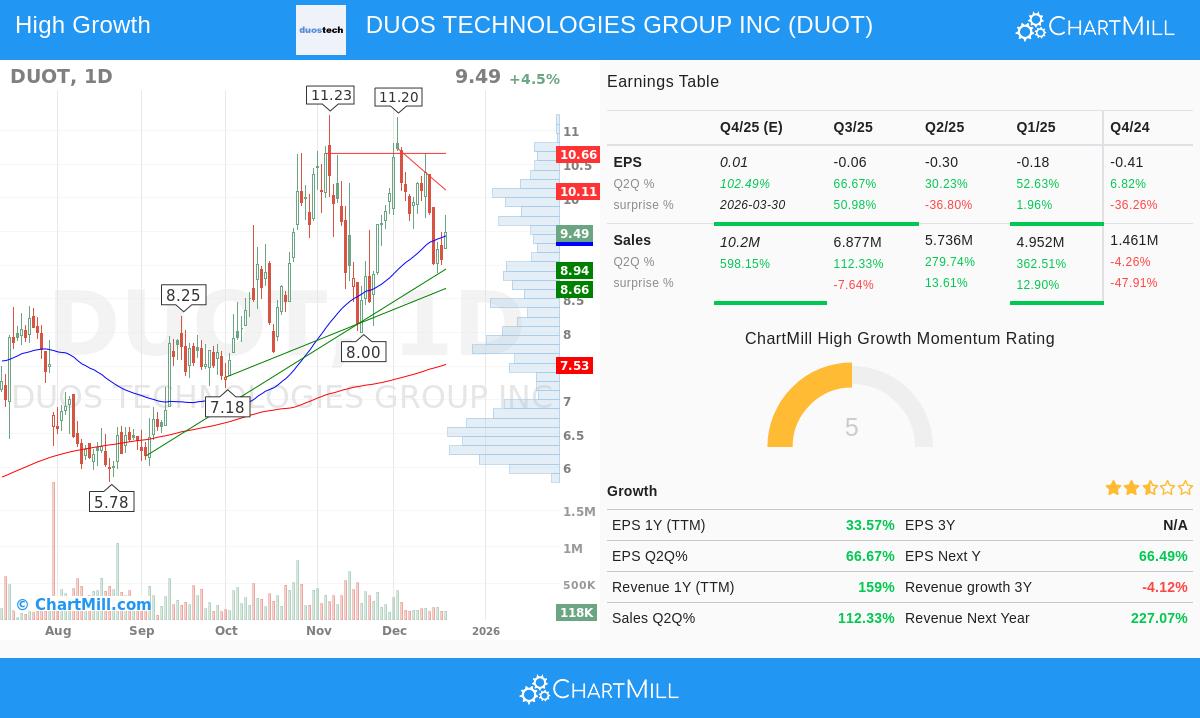
- Moving Average Arrangement: The stock's price of $9.49 trades above all main simple moving averages (SMAs), the 50-day ($9.44), 150-day ($8.05), and 200-day ($7.53). Importantly, the shorter-term averages are ordered above the longer-term ones, with the 50-day SMA above both the 150-day and 200-day, and the 150-day above the 200-day. This "ordered" setup is a classic sign of a sound, speeding uptrend.
- Rising Averages: Both the 150-day and 200-day SMAs are confirmed to be climbing, showing continued long-term buying pressure and a positive base for the trend.
- Closeness to Highs: DUOT's current price sits about 15.5% below its 52-week high of $11.23, well inside the Template's need of being within 25% of the high. At the same time, the price is roughly 147% above its 52-week low of $3.84, far passing the 30% minimum. This pairing indicates strong recovery momentum and placement near peak strength.
- Better Relative Strength: With a ChartMill Relative Strength (CRS) rating of 92.98, DUOT is doing better than nearly 93% of all stocks in the market over the past year. Minervini notes that real market leaders show high relative strength, as it points to institutional demand and performance separate from wider market moves.
This technical view proposes DUOT is in a confirmed uptrend, meeting the strict entry conditions that form the first part of the Minervini method.
Checking High-Growth Momentum Fundamentals
While the Trend Template deals with the "when" to buy, the "what" to buy is often set by fundamental growth. The screening process also used a High Growth Momentum (HGM) filter, which examines the speed and quality of a company's financial expansion. For growth investors, speeding earnings and sales are main catalysts that can push continued price increase. DUOT's recent financial metrics show several strong growth signs:
- Very High Top-Line Growth: The company's revenue growth on a trailing twelve-month (TTM) basis is at a notable 159%. Even more notable is the recent quarterly momentum, with the last reported quarter showing year-over-year sales growth of 112%. Analysts expect this speeding to continue, with guesses for the next quarter pointing to an almost 600% rise in sales compared to the same time last year.
- Earnings Path Betterment: Although the company is not yet profitable on a net basis, the direction in earnings per share (EPS) is showing clear betterment. The EPS loss has lessened notably year-over-year on a TTM basis, and the most recent quarter saw a 66.7% betterment in EPS compared to the year-ago quarter. Also, analyst feeling is turning positive, with the average EPS guess for the next full year changed upward by over 11% in the last three months.
- Operational Performance: The company has passed analyst EPS guesses in two of the last four quarters. This record of beating expectations can build investor trust and act as a positive catalyst for the stock.
These fundamental factors show that DUOT's recent stock price strength may be supported by real and speeding business performance, a main idea for investors aiming at high-growth chances.
Technical Condition and Setup Summary
Beyond the specific Trend Template conditions, a wider look at DUOT's technical condition is solid. ChartMill's own Technical Rating gives the stock a complete score of 10 out of 10, putting it in the top group of all stocks from a technical view. The long-term trend is rated as positive, while the short-term trend is neutral, proposing a time of consolidation within the larger uptrend. This is seen in a moderate Setup Quality rating of 5, showing the stock is trading inside a range after its recent rise. Main support levels are found between $8.94 and $9.07, with more support near $8.66. A clear move above nearby resistance around $10.11 could signal the next step higher.
For a full breakdown of the support, resistance, and trend study, you can check the full ChartMill Technical Report for DUOT.
Conclusion
Duos Technologies Group Inc presents a case where a strict, rules-based screening process finds meeting between technical trend strength and fundamental growth momentum. The stock meets the strict technical checklist of the Minervini Trend Template, confirming its part in a continued uptrend with better relative performance. At the same time, its very high revenue growth and bettering earnings path provide the fundamental catalyst that growth investors look for. This pairing makes DUOT a notable candidate for more study by investors using strategies focused on momentum and growth.
Interested in finding similar potential candidates? You can run the same "High Growth Momentum + Trend Template" screen used to find DUOT to find other stocks that meet these paired conditions. Look at the screen and its current results here.
,
Disclaimer: This article is for informational and educational purposes only. It is not intended as investment advice, nor does it constitute a recommendation to buy, sell, or hold any security. The analysis is based on data provided and certain screening methodologies, investors should conduct their own thorough research and consider their individual financial situation and risk tolerance before making any investment decisions.