
In the world of equity investing, combining fundamental strength with timely technical patterns is a method many investors use to find possible opportunities. One such idea is to look for solid growth stocks that also show encouraging technical breakout patterns. The reasoning is clear: first, find companies with good underlying business condition, steady profitability, and increasing earnings and revenue growth. Then, add a technical study to find those where the price is coming together or preparing for a possible rise, indicating market opinion may be matching the fundamental story. This technique aims to join the "what" (a good company) with the "when" (a good entry point).
Dynatrace Inc (NYSE:DT) appears as a stock that meets this joined standard. The company, a top provider in software intelligence and application performance monitoring, works in the large and increasing market of observability and IT operations software.
Fundamental Strength: The Growth Engine
A close look at Dynatrace's fundamentals shows a company performing well in several areas. According to its fundamental analysis report, DT gets an overall score of 7 out of 10, with especially high marks in Growth (8) and Profitability (8). This matches well with the first part of the screening method, finding companies with solid, maintainable growth.
- Strong Historical Growth: Over recent years, Dynatrace has shown notable expansion.
- Revenue has increased at an average yearly rate of 25.49%.
- Earnings Per Share (EPS) has increased more quickly, at an average of 35.19% per year.
- Good Profitability Measures: Growth has not hurt profits. The company keeps high margins.
- A Profit Margin of 27.33% puts it in the high group of its software industry peers.
- Its Return on Equity (ROE) of 18.22% is also with the best in the field, showing efficient use of shareholder money.
- Financial Condition: With a Health score of 7, the company keeps a solid balance sheet. An important positive is the lack of any debt, giving financial room and lowering risk. While some liquidity measures are middle level, they are viewed with the company's good solvency and cash-making ability.
This fundamental picture is important for the method because it looks for companies that are not just increasing quickly but are doing so profitably and in a maintainable way. A solid balance sheet gives strength, while high profitability indicates a lasting competitive edge, key qualitative factors for a good growth stock, as described in the setting of growth investing.
Technical Setup: The Timing Signal
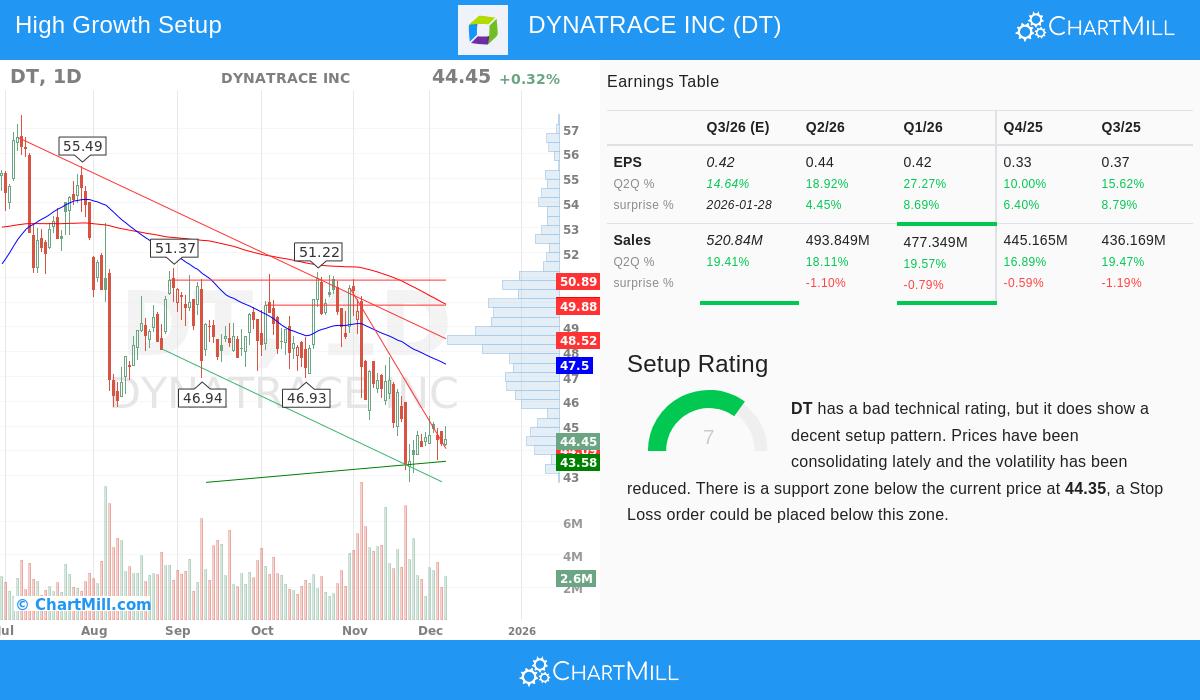
While the fundamentals show a high-quality company, the technical study gives a view into its present market position. The technical analysis report for DT gives a mixed view. The overall technical score is low, affected by poor short and long-term trends, with the stock trading much below its 52-week high. However, inside this larger drop, a specific and possibly encouraging setup has appeared.
The report points out a Setup Score of 7, stating that "DT does present a nice setup opportunity." This is described by lower volatility and a time of price stabilization after a fall. The stock is now checking a set support area between about $43.58 and $44.35, made by a mix of moving averages and trendlines. The existence of this support level below the present price allows for a clear setting of risk, a key part of a technical breakout idea.
For the joined method, this technical view is seen as a possible base pattern. After a large drop, the price action is steadying. A clear move above the nearby resistance area (around $48.50 to $48.80) could mark a change of the short-term drop and confirm a breakout, possibly matching the stock's price movement with its solid fundamental path.
Valuation Context
Given its growth picture, valuation is a key point. Dynatrace's valuation score is a middle 5. Its Price-to-Earnings (P/E) ratio of 28.5 is about equal to the wider S&P 500 and is actually lower priced than many of its software industry peers. More significantly, when growth is included via the PEG ratio, the valuation seems acceptable. The study indicates the company's high profitability may support its present multiples, particularly if it can keep its high growth rates.
Conclusion
Dynatrace shows a case where an engaging fundamental growth story meets a technical chart that is trying to form a bottom. The company does well in the quantitative standards important for growth investing, fast revenue and earnings growth, high profitability, and a clear balance sheet. At the same time, its chart displays the signs of a stabilization setup after a drop, offering a set technical plan for investors.
This mix is what the "Strong Growth Stocks with Good Technical Setup" screen is made to find, fundamentally sound companies where the price action may be getting ready for its next rise. It is a note that even stocks in a longer-term corrective stage can present planned opportunities when their main business strength stays strong.
Interested in finding more stocks that join solid growth fundamentals with encouraging technical patterns? You can examine the full screening process and see present results by visiting the Strong Growth Stock Technical Setups Screen.
Disclaimer: This article is for information only and does not make financial advice, a suggestion, or an offer or request to buy or sell any securities. The information given is based on data supplied and should not be the only base for any investment choice. Investing includes risk, including the possible loss of principal. Always do your own study and think about talking with a qualified financial advisor before making any investment choices.